
Gross Domestic Product by State: Quarter Four Data Release
By Taylor Hendrix, Workforce Insights Analyst

What is Gross Domestic Product?
Gross domestic product (GDP) by state is the market value of goods and services produced by labor and property located in a state. When referring to “real dollars” vs. “current dollars” in the economic world, “real dollars” are inflation-adjusted values, and “current dollars” are reflective of prices for the period when the transactions occurred. Analyzing GDP is the most comprehensive measure of U.S. economic activity conducted by the Bureau of Economic Analysis.[1]
According to the BEA’s release, real GDP increased in all 50 states in the fourth quarter of 2023. The percent change for real GDP ranged from 6.7 percent in Nevada to 0.2 percent in Nebraska. Current GDP increased in 49 of 50 states, with the percent change ranging from 9.7 percent in Texas to -0.4 percent in Nevada (the only state that reported a decline).
How does South Carolina compare to the Southeast region?
South Carolina vs. the Southeast
For the fourth quarter of 2023, the Southeast[2] region was a 6.1 trillion current dollar economy and a 5.0 trillion real dollar economy. South Carolina fell in the middle of the group, with a 331 billion current dollar economy and a 265 billion real dollar economy. The state in the region with the largest economy was Florida at 1.6 trillion current and 1.3 trillion real dollars, and the state with the smallest economy was West Virginia with 102 billion current and 81 billion real dollars. Below is a graphic depicting the 2023 current-dollar figures for the Southeast region.
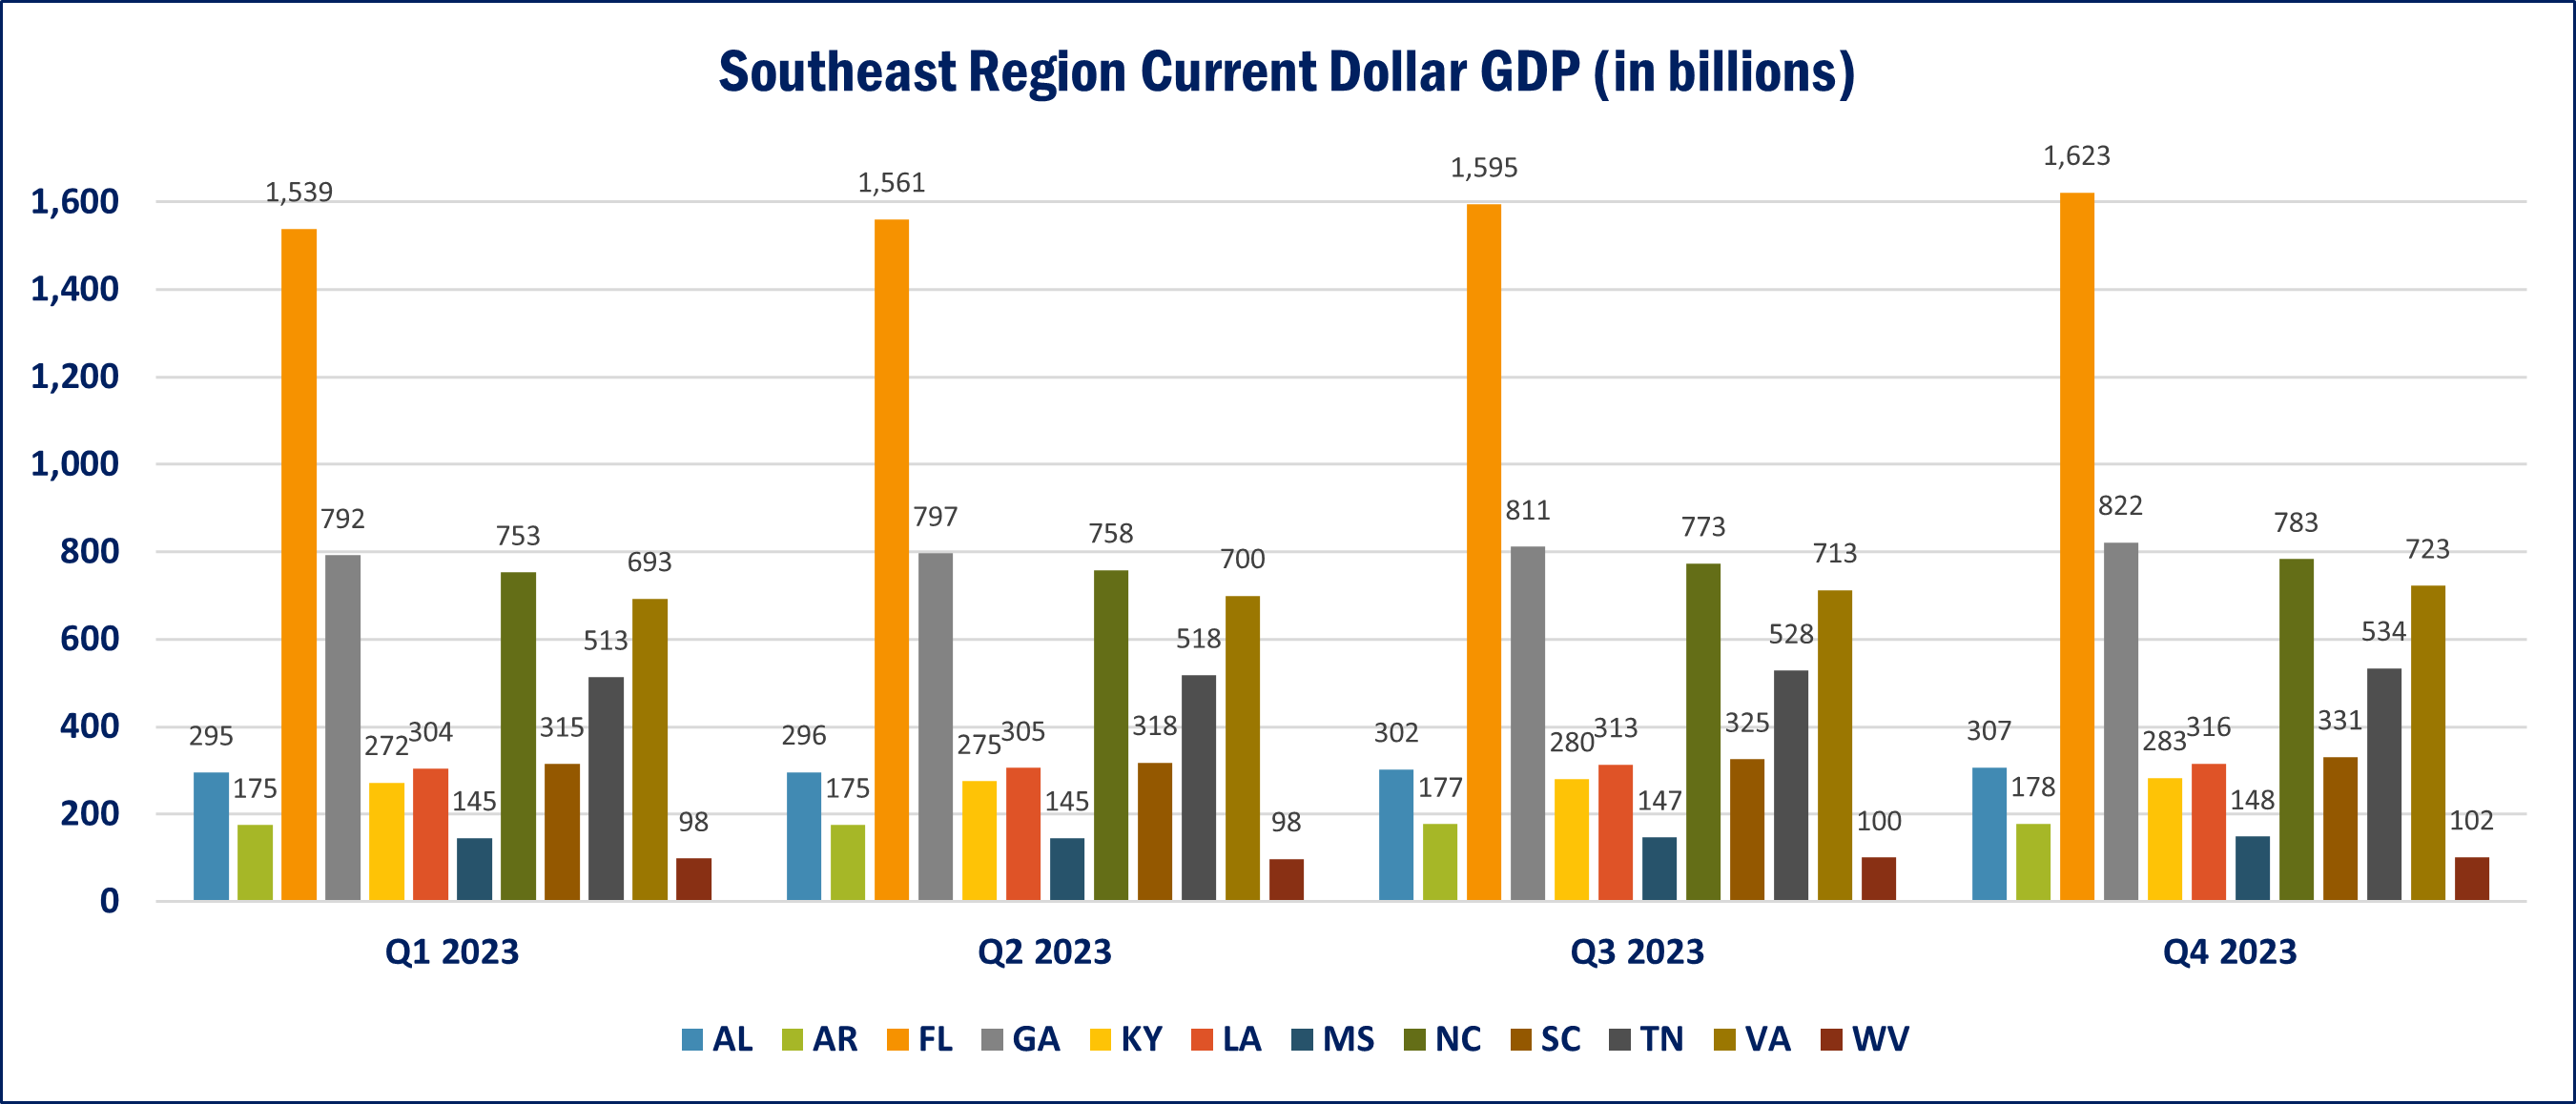
As of the fourth quarter, the current dollar GDP percent change for the Southeast region was 5.6, down from 8.3 in the 3rd quarter. Comparing year-over-year results, all states in the Southeast region had less growth in 2023 than 2022. South Carolina, however, had the smallest drop-off, reporting only a 1.3 percentage point drop between the periods. See the table below for further information.
|
Region/State |
2022 Percent Change |
2023 Percent Change |
Change in Growth (in percentage points) |
|
Southeast Region |
9.8 |
7.3 |
-2.5 |
|
Alabama |
9.1 |
6.6 |
-2.5 |
|
Arkansas |
9.3 |
6.2 |
-3.1 |
|
Florida |
11.3 |
9.8 |
-1.5 |
|
Georgia |
9.4 |
5.0 |
-4.4 |
|
Kentucky |
8.8 |
7.2 |
-1.6 |
|
Louisiana |
10.9 |
6.0 |
-4.9 |
|
Mississippi |
9.0 |
4.6 |
-4.4 |
|
North Carolina |
8.6 |
7.1 |
-1.5 |
|
South Carolina |
9.6 |
8.3 |
-1.3 |
|
Tennessee |
10.8 |
7.7 |
-3.1 |
|
Virginia |
8.0 |
6.6 |
-1.4 |
|
West Virginia |
12.6 |
2.1 |
-10.5 |
[1] Bureau of Economic Analysis, Gross domestic product by state and personal income by state, 4th quarter 2023, https://www.bea.gov/news/blog/2024-03-29/gross-domestic-product-state-and-personal-income-state-preliminary-2023-0
[2] The Southeast region consists of Alabama, Arkansas, Florida, Georgia, Kentucky, Louisiana, Mississippi, North Carolina, South Carolina, Tennessee, Virginia, and West Virginia.