South Carolina 2019 Income Compared to 2021
By Carol Hayman, Workforce Insights Analyst
South Carolinians are making more money than before the pandemic, but that money won't buy as much due to inflation. According to an analysis of 2019 and 2021 IRS income tax data conducted by The Post and Courier1 on April 15, 2024, the average South Carolina household income rose more than $11,000 in that timeframe, from $63,516 to $74,835. That’s an increase of almost 18 percent. This selected time frame provides a rough snapshot of household wages before and after the COVID pandemic began.
South Carolina Individual Income Tax Returns: Size of AGI, Tax Years 2019 vs. 2021
|
Size of adjusted gross income by county |
2019 Number of returns2 |
2019 Percent |
2021 Number of returns2 |
2021 Percent |
# Change of returns 2019 to 2021 |
% Change of returns 2019 to 2021 |
|
SOUTH CAROLINA |
2,356,370 |
100.0% |
2,447,340 |
100.0% |
90,970 |
3.9% |
|
Under $1 |
31,290 |
1.3% |
54,020 |
2.2% |
22,730 |
72.6% |
|
$1 under $10,000 |
311,850 |
13.2% |
296,590 |
12.1% |
(15,260) |
-4.9% |
|
$10,000 under $25,000 |
515,130 |
21.9% |
485,140 |
19.8% |
(29,990) |
-5.8% |
|
$25,000 under $50,000 |
603,270 |
25.6% |
608,200 |
24.9% |
4,930 |
0.8% |
|
$50,000 under $75,000 |
317,190 |
13.5% |
334,820 |
13.7% |
17,630 |
5.6% |
|
$75,000 under $100,000 |
196,100 |
8.3% |
208,260 |
8.5% |
12,160 |
6.2% |
|
$100,000 under $200,000 |
286,230 |
12.1% |
329,340 |
13.5% |
43,110 |
15.1% |
|
$200,000 or more |
95,310 |
4.0% |
130,970 |
5.4% |
35,660 |
37.4% |
Source: IRS, Statistics of Income Division, Individual Master File System, February 2024.
South Carolina households mostly brought in stronger income in 2021. Tax returns with an adjusted gross income of $25,000 or less dropped off significantly since 2019, and there were many more households reporting $100,000 or more.
Consumer Prices Over Time
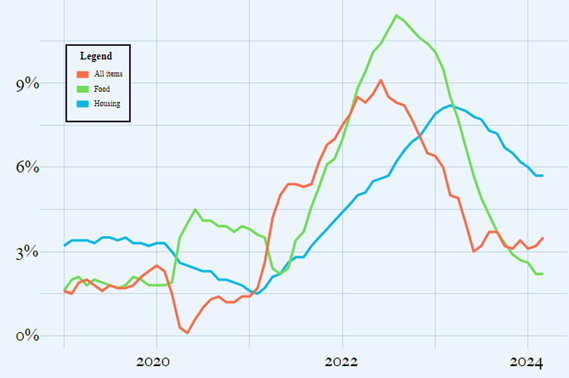
The data shows that household gains in earnings have unfortunately been neutralized (or worse) by inflation. The cost of living has risen 21% since the start of the pandemic in March 2020. Housing prices were up 22 percent since then and food prices rose 25 percent. The graph below tracks the rise and fall of consumer prices since 2019.

Source: US Department of Labor
Conclusion
Although 2021 tax returns show South Carolina households getting richer, high levels of inflation may have cut into those gains, leaving many with less purchasing power than they had before the pandemic. Inflation is trending back to 2019 levels, however, which could provide some relief.
1The Post and Courier, April 2024
2 "Number," here, and elsewhere, represents number of returns, unless otherwise specified. The number of returns has been rounded to the nearest ten.
