U.S. Employment Projections, 2023-2033
By Lainey Stalnaker, Data Analytics Writer

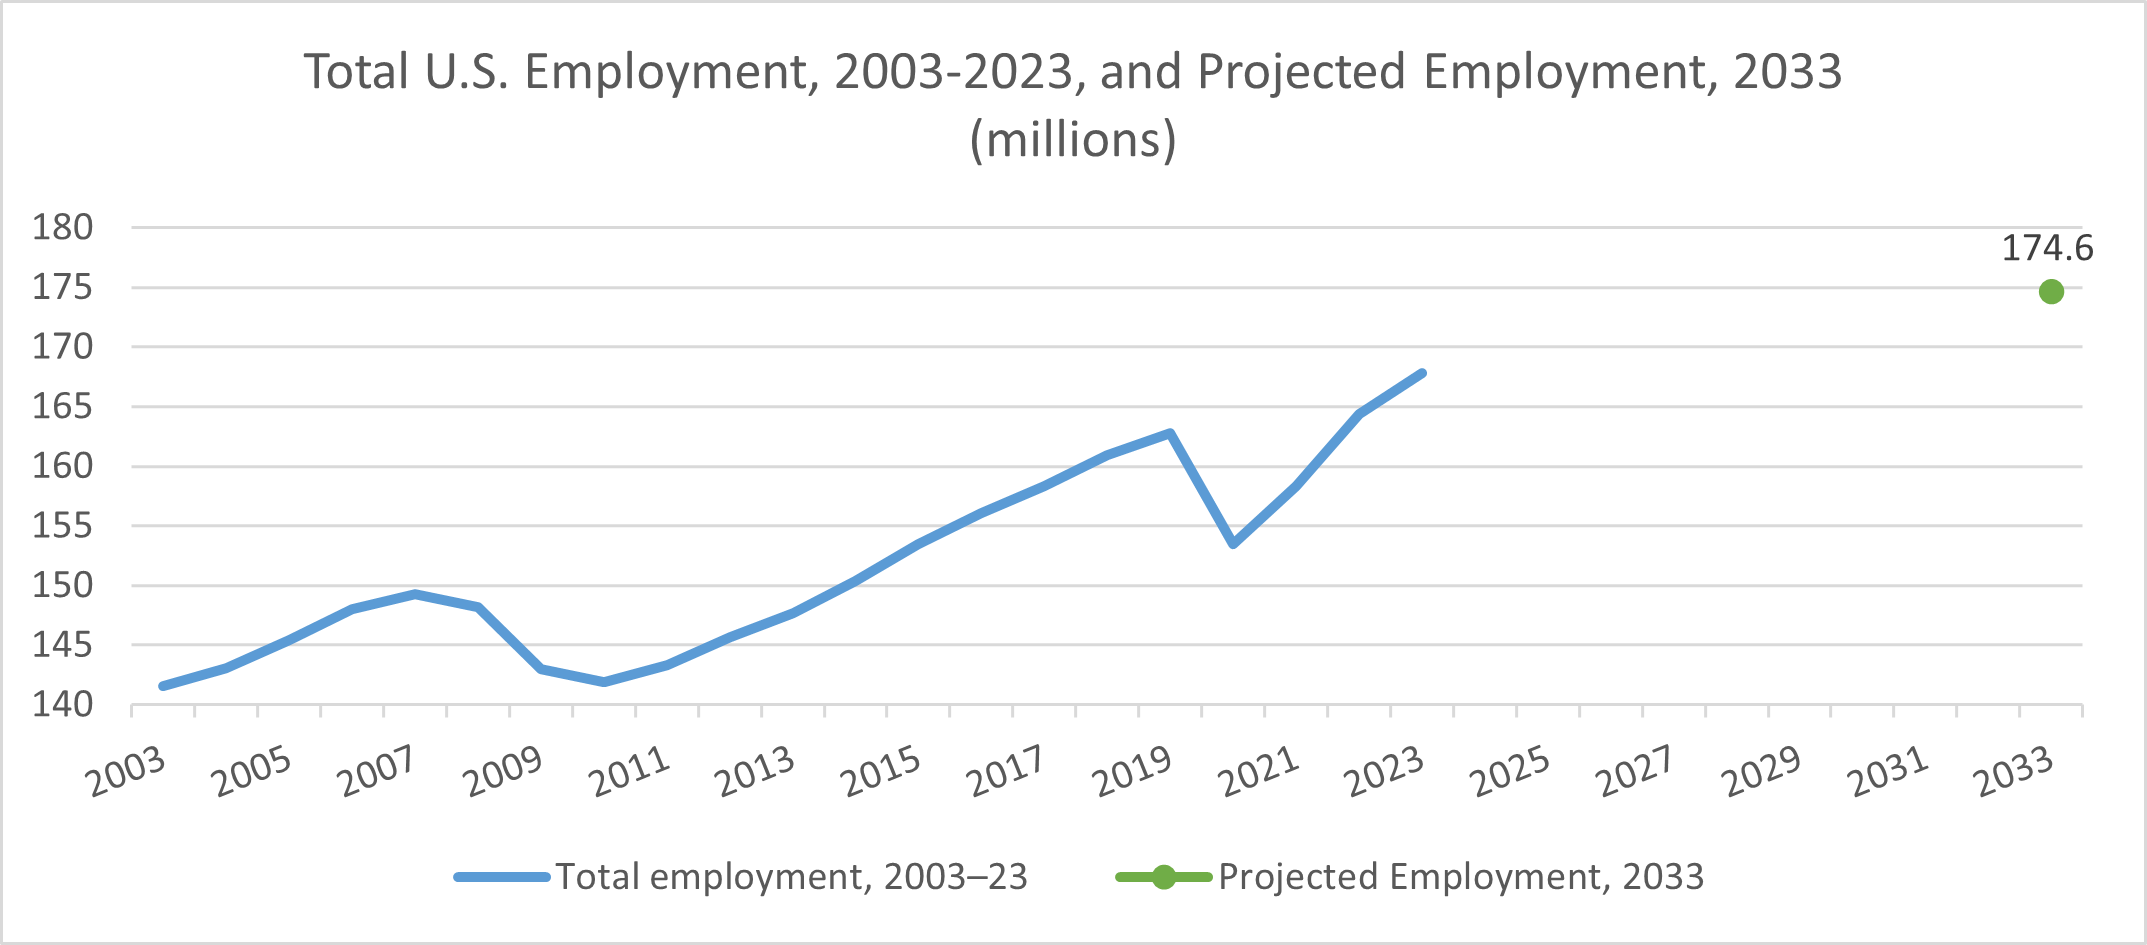
U.S. employment is projected to reach 174.6 million in 2033, an increase of 4.0 percent—or 6.8 million jobs—over ten years.[1] This is considerably slower than the growth we’ve seen over the last ten years—from 2013 to 2023, total employment grew by 13.7 percent. The current 10-year projection is closer to the 4.3 percent growth rate recorded from 2003 to 2013.
Employment during the 2003 to 2013 period was stunted by the 2008 recession, when U.S. employment hit a low of 141.9 million in 2010, a 5.0 percent drop from 2007. Employment did not return to 2007 levels until 2014 and increased steadily up until 2019. From 2019 to 2020, employment dropped 5.7 percent in connection with the COVID-19 pandemic but recovered quickly. See the figure below for total employment data from 2003 to 2023 and projected employment for 2033.
The slower growth expected in the next 10 years is primarily attributed to demographic changes. The U.S. population is aging, which means more people will be exiting the workforce, and younger cohorts will shrink in size. Altogether, these shifts are expected to drive changes in demand, but this does not mean all occupations will be affected equally.
[1]https://www.bls.gov/opub/mlr/2024/article/industry-and-occupational-employment-projections-overview-and-highlights-2023-33.htm

When examining wage and salary employment by industry, the professional, scientific, and technical services sector is expected to grow the most over the next ten years—10.5 percent. Healthcare and social assistance is in second place with projected growth of 10.0 percent. Because the population is aging, there should be a greater demand for health and social services, as demand for these services is disproportionately driven by older citizens. Management of companies and enterprises, information, and utilities round out the top five.
Retail trade is the only sector expected to lose jobs, with a projected decline in employment of 2.3 percent. Mining, quarrying, and oil and gas extraction is not expected to grow at all. Educational services is expected to grow just 0.7 percent. Again, because the population is aging and growth is slowing, and because younger age groups drive demand for these services, there should be slower job growth in this sector. Rounding out the bottom five are agriculture, forestry, fishing, and hunting; and then manufacturing, which are both projected to increase their employment by 0.8 percent.
By OccupationAmong occupation groups, healthcare support is expected to grow the most—15.2 percent. Home health and personal care aides, a profession classified under this group, is expected to add more jobs than any other occupation. Computer and mathematical occupations are projected to increase their employment by 12.9 percent, followed by healthcare practitioners and technical occupations, which are expected to record an 8.6 percent increase in employment.
Four occupations are expected to decline in total employment. Office and administrative support occupations are projected to decline by 3.5 percent. Sales and related occupations are expected to lose 2.0 percent of current total employment. Farming, fishing, and forestry jobs are projected to fall 1.9 percent, and production jobs are expected to decline by 1.0 percent. Educational instruction and library occupations are expected to grow just 1.6 percent.
Considerations for South CarolinaThe above projections are influenced in part by expected demographic changes in the U.S. over the next ten years, specifically an aging population and a decline in younger age groups as a share of the total population—trends which we have also witnessed in South Carolina over the past decade. In 2013, South Carolina residents aged 60 or older comprised 21.4 percent of the population.[1] In 2023, that number rose to 26.2 percent.[2] Residents aged 24 and younger accounted for 26.8 percent of the population in 2013, but this figure fell to 25.0 percent in 2023.
At the same time, South Carolina has become a popular destination for people relocating from other parts of the state in recent years. In 2023, 204,000 people moved to South Carolina from another state.[3] 135,000 people moved out of the state, meaning there was net migration of nearly 70,000 people. And when we examine people relocating specifically for the purpose of finding a new job, South Carolina has also fared well. In quarter three of 2023, South Carolina had the fourth highest net migration of job switchers in the country, and South Carolina was first for number of job switchers moving into the state as a percentage of all job changers.[4] It’s a remarkable stat: out of all the people who took a new job in South Carolina in Q3 2023, 57.3 percent came from another state. Clearly, these new South Carolinians are being drawn by the growing job market and lower cost of living.
[1]https://data.census.gov/table/ACSST1Y2013.S0101?q=south%20carolina%20population%20age
[2]https://data.census.gov/table/ACSST1Y2023.S0101?q=south%20carolina%20population%20age
[3]https://www.census.gov/data/tables/time-series/demo/geographic-mobility/state-to-state-migration.html?utm_campaign=20241017pio&utm_medium=email&utm_source=govdelivery
[4]https://www.nar.realtor/blogs/economists-outlook/job-relocation-trends-and-the-impact-on-local-real-estate-markets
