
2024 Population Estimates: Migration Drives Rapid Growth in South Carolina
By Lainey Stalnaker, Data Analytics Writer

From July 2023 to July 2024, South Carolina’s population grew at a rate of 1.7 percent. 91,000 more people now reside in the state, bringing the total population to 5,479,000 as of July 2024.[1] The majority of this growth stemmed from domestic migration, and counties comprising metropolitan statistical areas (MSAs)[2] were most attractive to movers.
Coastal Areas Take Top Spots for Growth
Jasper County, situated between Hilton Head Island and Savannah, Georgia, was the third fastest growing county in the nation with 5.9 percent population growth. A total of six South Carolina counties made the top 100 out of over 3,000 in the United States, including Horry County, ranking 34th with 3.8 percent growth, and Berkeley County, ranking 61st with 3.2 percent growth. Other counties in the top 100 were Spartanburg, Edgefield, and Dorchester.
Only nine of 46 counties in the state recorded population declines. Most were rural counties located along the I-95 corridor. Marlboro recorded the greatest decline at -1.1 percent, followed by Bamberg at -0.9 percent and Allendale at -0.6 percent. The remaining six SC counties lost 0.5 percent or less of their total population.
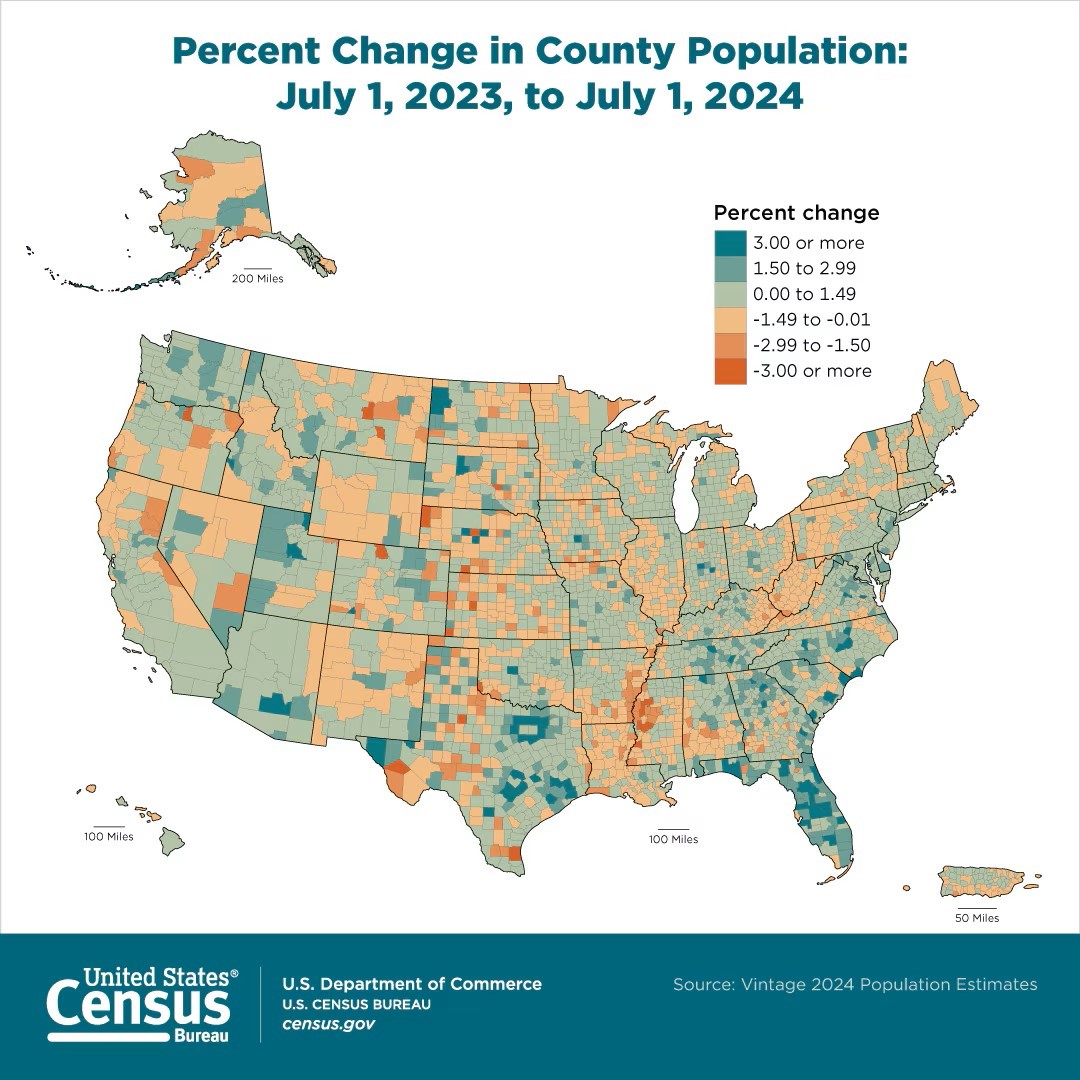
The map below compares population change across the country, with counties in green reporting population growth and counties in orange reporting population declines. The counties shaded the darkest green grew at a rate of 3.0 percent or more, placing them in the 97th percentile for growth.
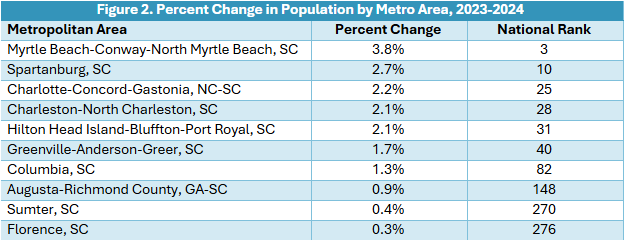
All ten metropolitan statistical areas in South Carolina recorded population growth from 2023 to 2024. The Myrtle Beach-Conway-North Myrtle Beach metro area ranked third in the country with 3.8 percent growth. Spartanburg was tenth with 2.7 percent growth. Figure 2 lists growth rates and national rankings for all 10 MSAs in the state. [3]
Growth was primarily concentrated in coastal areas of the state, such as Horry County, and in the Upstate, particularly in Spartanburg, Greenville, Lancaster, and Laurens Counties. Growth was higher, in some cases, in counties farther from the MSA’s central city. Jasper County, for example, grew faster than Beaufort County (location of Hilton Head Island). Berkeley and Dorchester Counties, which were the third and sixth fastest growing counties in the state, grew faster than Charleston County (location, of course, of Charleston).
Within the Charlotte-Concord-Gastonia metro area, Lancaster County grew faster than Mecklenburg County, North Carolina (location of Charlotte). Within the Augusta-Richmond County metro area, Edgefield, the fifth fastest growing county in the state, grew faster than Richmond County, Georgia (location of Augusta). Aiken County, in the same MSA, grew faster than Richmond County, as well. This suggests that movers are being attracted to suburban regions of more densely populated metro areas within South Carolina.
Domestic Migration Makes Biggest Impact
South Carolina’s recent population growth has primarily been driven by domestic migration. From 2023 to 2024, the South was the only region in the country to record net gains in domestic migration, meaning more people relocated to the South than the number that moved from the South to another part of the country.
Were it not for such high rates of migration, South Carolina’s population would have stagnated. From 2023 to 2024, the number of births and deaths in the state were roughly equal, with deaths exceeding births by a slim margin of 500. Meanwhile, South Carolina netted over 68,000 domestic migrants.
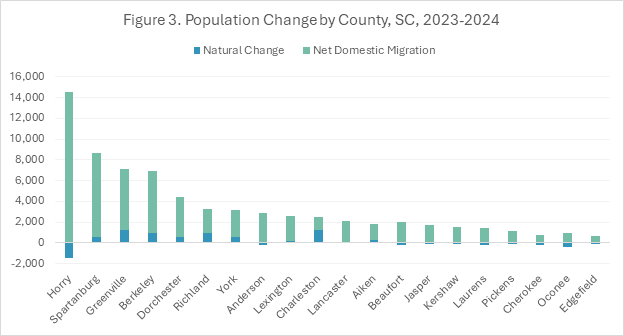
At the county level, just 11 of 46 counties recorded positive natural growth, but only seven counties had negative net migration, meaning in almost every county, more people moved in than out. Figure 3, below, depicts the stark difference between natural change in population and net migration in the counties with the largest numeric increases in population. Even in those with relatively high birthrates, migration far outpaces native population growth.
[1] https://www.census.gov/data/tables/time-series/demo/popest/2020s-counties-total.html
[2] A metropolitan statistical area (MSA), as defined by the Census Bureau, comprises a county or counties with at least one urban area of at least 50,000 population, plus adjacent counties that have a high degree of social and economic integration with the core, measured through commuting ties.