
Strong In-Migration to South Carolina in Recent Years
By Leah Price, Workforce Insights Analyst
South Carolina has experienced strong population growth since the start of the pandemic in 2020 that has outpaced most of the United States. According to moveBuddha, an IT and technology company focused on domestic relocation, South Carolina was number one for inflow-to-outflow ratio in 2023 at 2.11 (meaning, for every person who moved out of the state that year, 2.11 moved in from elsewhere). Additionally, Myrtle Beach and Greenville were among the top 10 cities nationwide in 2023 for most favorable inflow-to-outflow ratios.
moveBuddha concluded, using its proprietary data, that South Carolina’s appeal is likely due to a combination of lower cost of living, comfortable climate, and ease of access to outdoor activities, as well as job growth in the healthcare and tech industries. With a cost of living that is 11.5% lower than the national average, people can move to the Palmetto State and see their housing dollars go a lot farther.
2023’s chart topping performance for inflow caps several consecutive years with strong numbers. The figures below show the other top states for 2023, as well those states’ ratios from prior years.
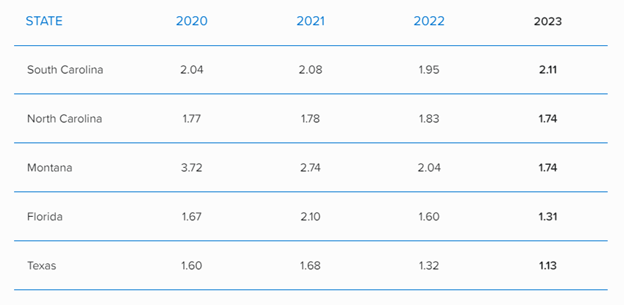
Source: moveBuddha, https://www.movebuddha.com/blog/moving-trends/; retrieved Jan. 4, 2024.
Looking at the average annual net migration figures for South Carolina from the Integrated Public Use Microdata Series (IPUMS, which uses individual-level census data) shows a similarly strong in-migration trend for 2016 through 2021. In fact, among those in the labor force, all age groups had positive net migration to the state (see the table below).
|
Age Group |
Average Annual In-Migrants in Labor Force |
Average Annual Out-Migrants in Labor Force |
Average Annual Net Migration into South Carolina |
|
16 to 19 years |
12,624 |
5,355 |
+7,269 |
|
20 to 24 years |
20,318 |
16,867 |
+3,451 |
|
25 to 29 years |
18,005 |
15,314 |
+2,692 |
|
30 to 34 years |
13,455 |
9,204 |
+4,251 |
|
35 to 44 years |
17,697 |
12,264 |
+5,433 |
|
45 to 54 years |
13,266 |
8,567 |
+4,699 |
|
55 to 59 years |
6,864 |
2,701 |
+4,162 |
|
60 to 64 years |
4,894 |
1,764 |
+3,130 |
|
65 to 74 years |
3,142 |
1,025 |
+2,117 |
|
75+ years |
277 |
195 |
+82 |
Source: IPUMS, ACS 1-Year (2016-2021)