Quarterly Census of Employment and Wages Data Analysis: Quarter Four, 2023
By Leah Price, Workforce Insights Analyst

The Quarterly Census of Employment and Wages (QCEW) is a data set composed of employment, total wage, and average weekly wage data by industry. These figures are acquired quarterly from employment and wage reports submitted by South Carolina employers. Industry data is categorized under the North American Industry Classification System (NAICS) by several different sectors, generally fitting into either a goods-producing or service-providing industry.
Statewide Employment and Wage by Industry Data
Statewide QCEW data is available across several variables including establishments, employment numbers in the first, second, and third months of the quarter, and average employment size for all three months, as well as total wages and average weekly wages for each industry. For the fourth quarter of 2023, the South Carolina industry with the most establishments was the Professional and Technical Services industry with 31,091. Health Care and Social Assistance was the industry with the most employment in all three months of the quarter, ranging from 309K to 312K each month. Manufacturing brought in the most total wages for this quarter, at 4.86 billion. The Management of Companies and Enterprises industry had the highest average weekly wage, with $1,991 in earnings. These trends remain generally consistent with data from recent quarters.
County Employment by Industry Data
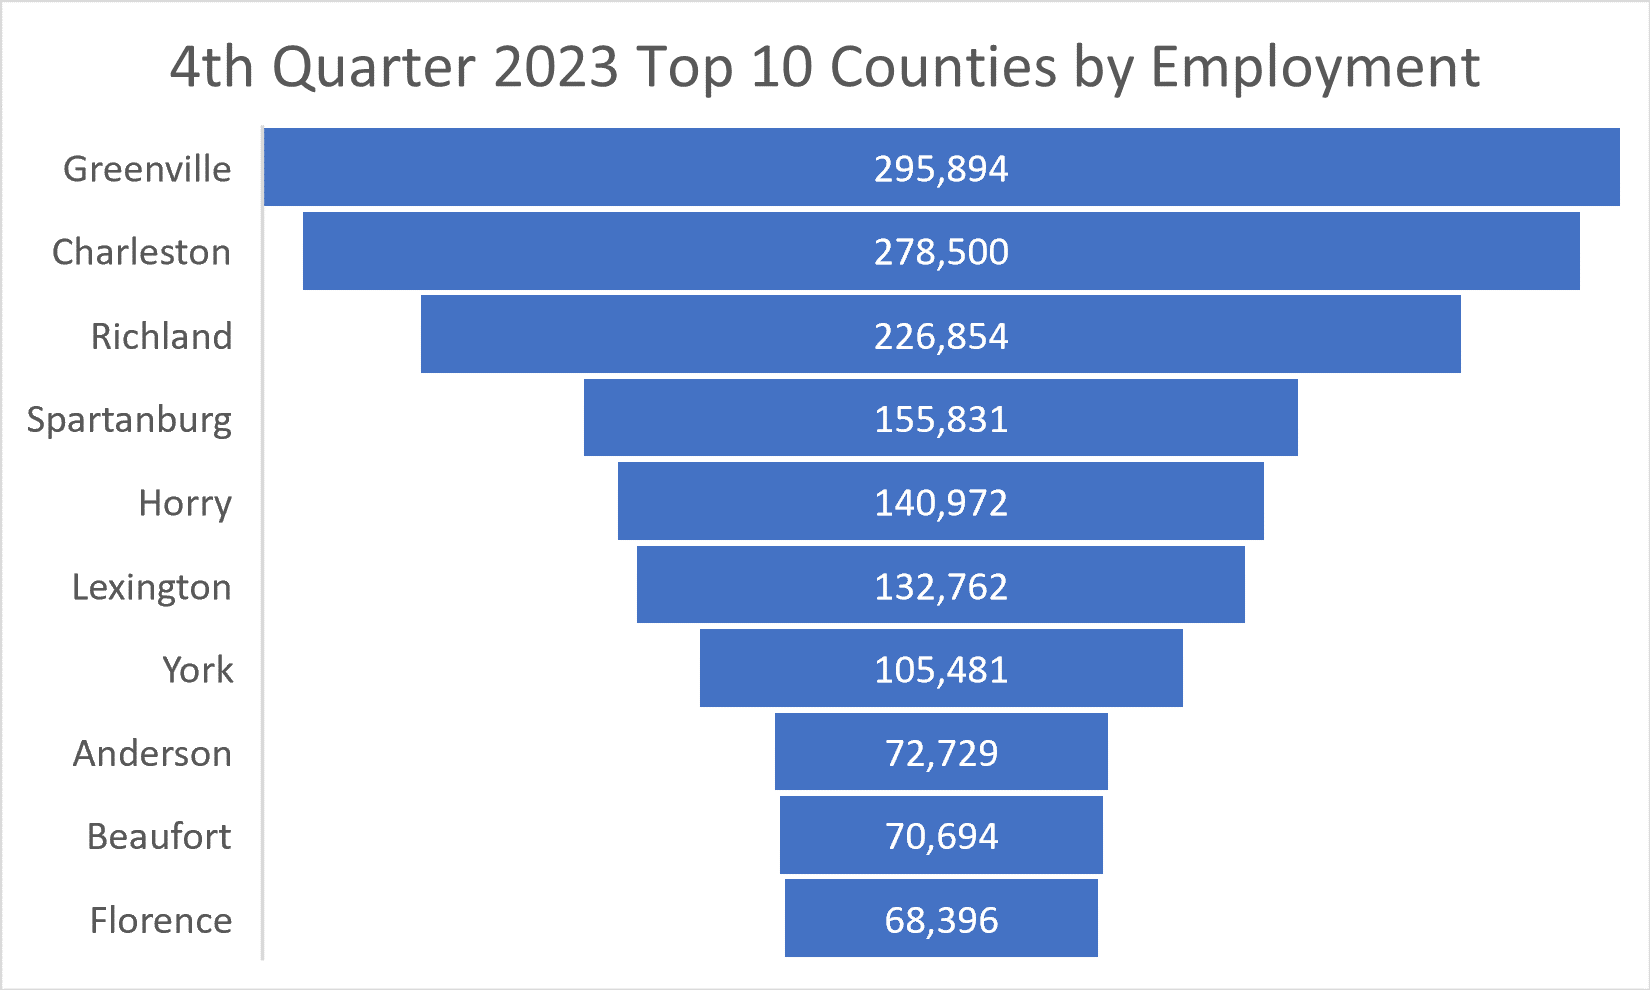
The three counties with the most employment for the fourth quarter of 2023 were Greenville (295,894), Charleston (278,500), and Richland (226,854). In those three counties, the Health Care and Social Assistance industry employed the most people at 44,603 for Charleston, 43,780 for Greenville, and 34,919 for Richland. Below is a data table showing the top 10 counties by employment.