Quarterly Census of Employment and Wages Data Analysis: Quarter One, 2024
By Lainey Stalnaker, Analytics Coordinator

Introduction
The Quarterly Census of Employment and Wages measures changes in employment, total wages, and average weekly wages at the national, state, and county levels. This data is collected through reports submitted by employers each quarter and categorized by sector according to the North American Industry Classification System (NAICS).
Employment by Industry
In March of 2024, South Carolina’s top three industries by employment were Retail Trade; Manufacturing; and Accommodation and Food Services. Retail Trade employed 265,842 people in March, and Manufacturing followed closely behind with 265,256 employees. Professional, Scientific, and Technical Services recorded the most establishments in quarter one at 31,969—over 11,000 more than Retail Trade, which had 20,311 establishments. In third place was Health Care and Social Assistance with 16,854 establishments.
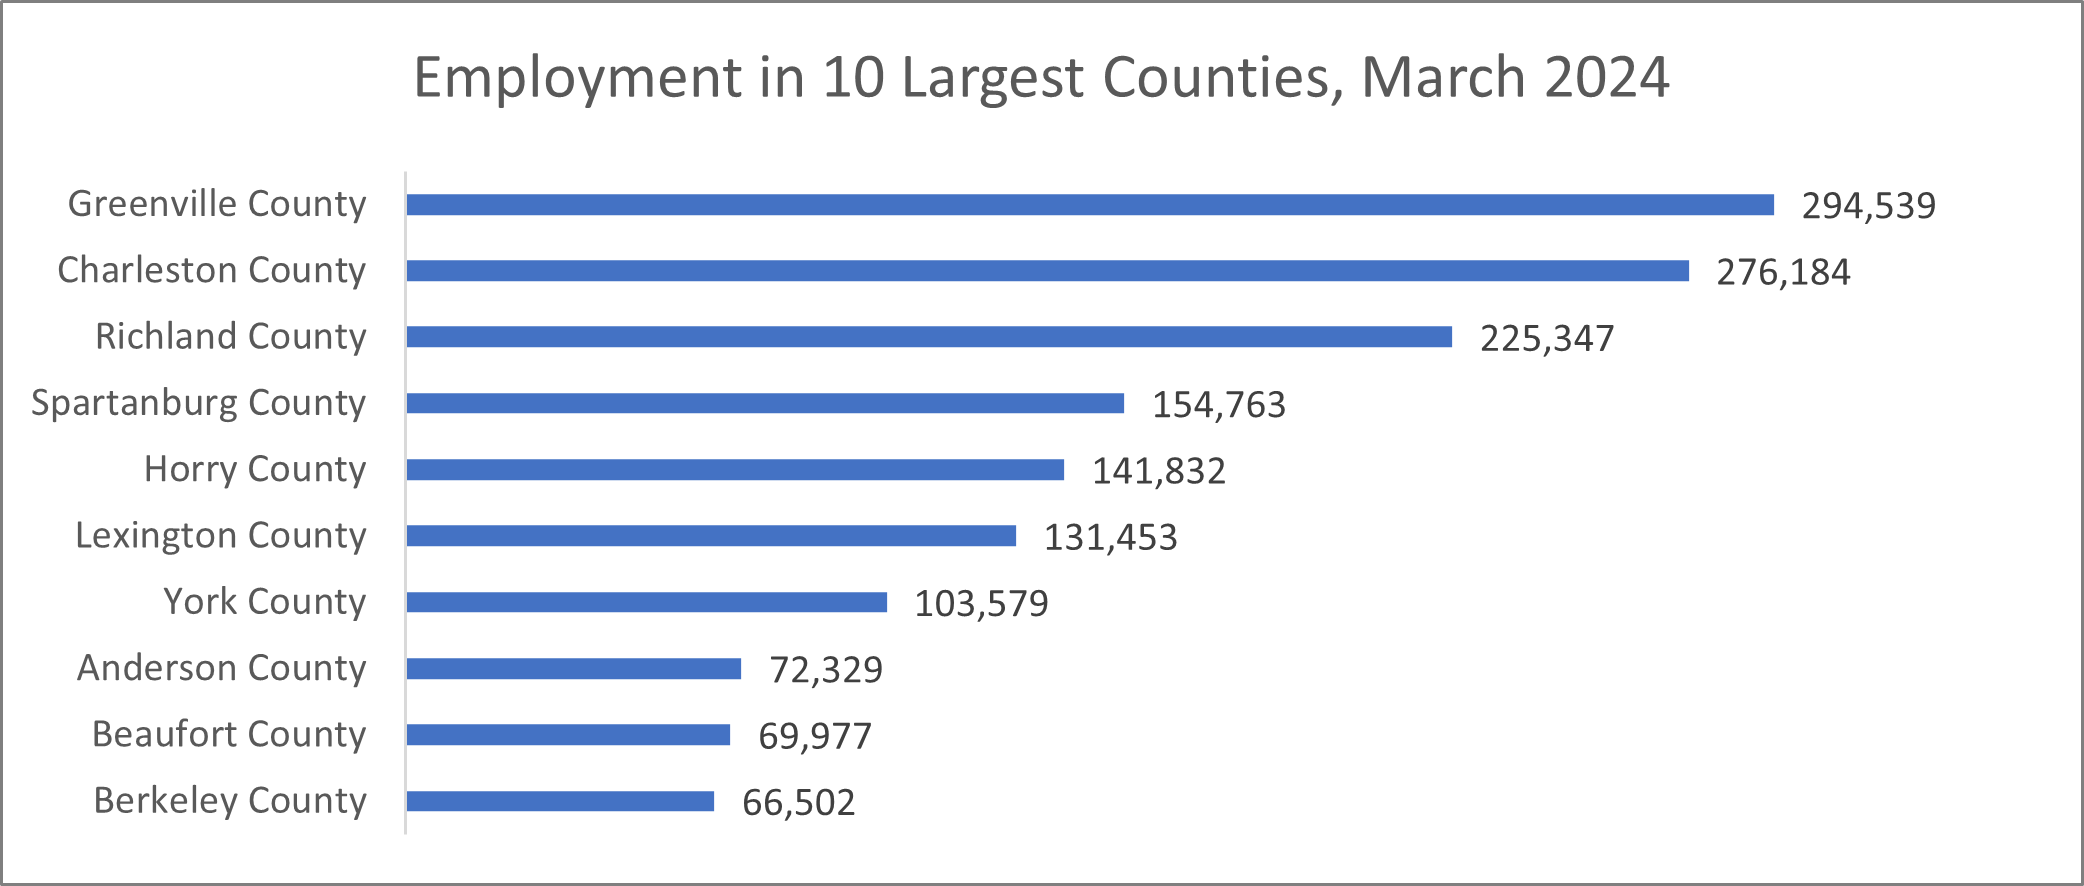
Employment by County
The county with the highest employment in March of 2024 was Greenville at 294,765. Behind Greenville was Charleston County, which employed 276,184 people. In third place, Richland County employed 225,347 people. The top industry by employment in Greenville County and Richland County was Health Care and Social Assistance. In Charleston County, this industry was second only to Accommodation and Food Services. The graph below displays employment data for the ten most populated counties in South Carolina.
Wages by Industry
Average weekly wages were up from the previous quarter. The industry with the highest average weekly wage was Utilities, increasing $430 from $2,015 to $2,445. The average weekly wage in the Management of Companies and Enterprises industry was $2,271, followed by the Information industry at $2,202. Finance and Insurance saw the largest jump from the fourth quarter of 2023 to the first quarter of 2024, increasing 27.0 percent from $1,700 to $2,159. The lowest paying industries were Retail Trade; Arts, Entertainment, and Recreation; and, in last place, Accommodation and Food Services, which is consistent with previous quarters.
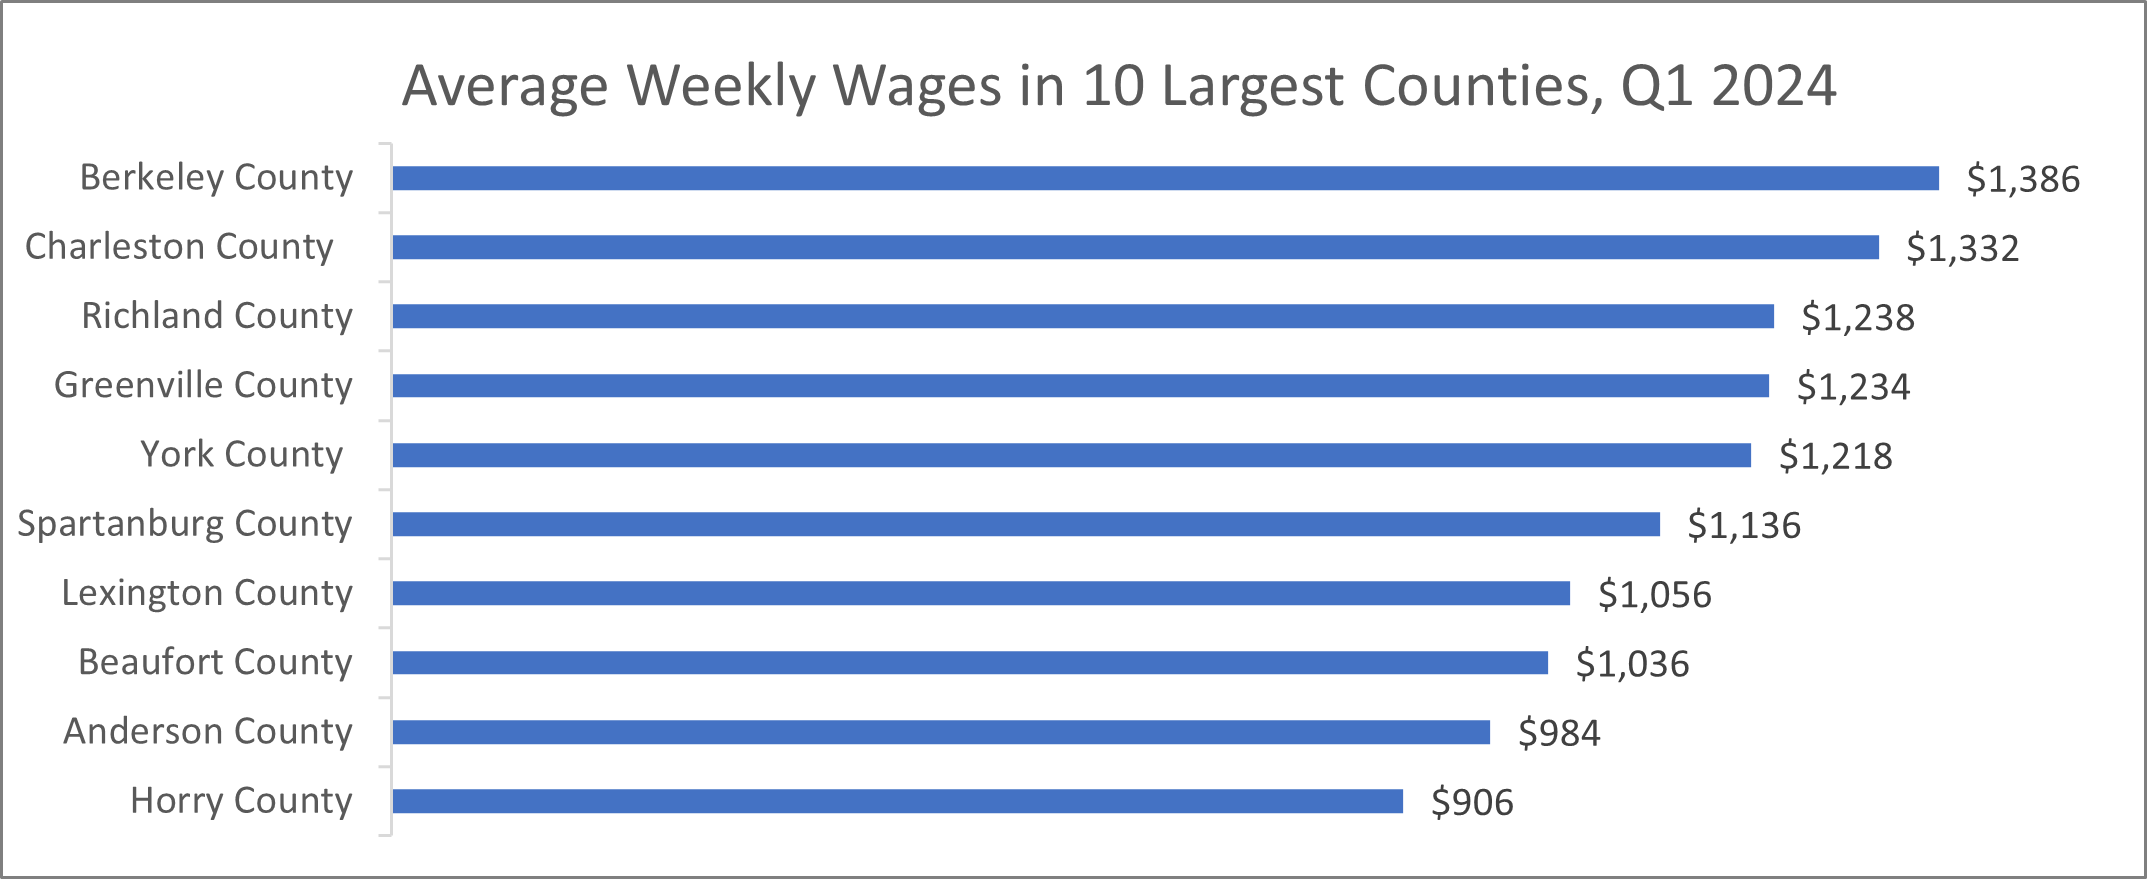
Wages by County
Among the ten largest counties in South Carolina, Berkeley County had the highest average weekly wage at $1,386, an increase of 7.4 percent from quarter four of 2023. The second highest wage was $1,332 in Charleston County. Richland County followed with a wage of $1,238, and the lowest wage—just $906—was in Horry County. The average weekly wage for all of South Carolina was $1,194, up 3.5 percent from the previous quarter. See the graph below for a visualization of average weekly wages in the ten largest counties in the state.