U.S. Employment-Population Ratio: 16-24 Year Olds
By Lainey Stalnaker, Analytics Coordinator

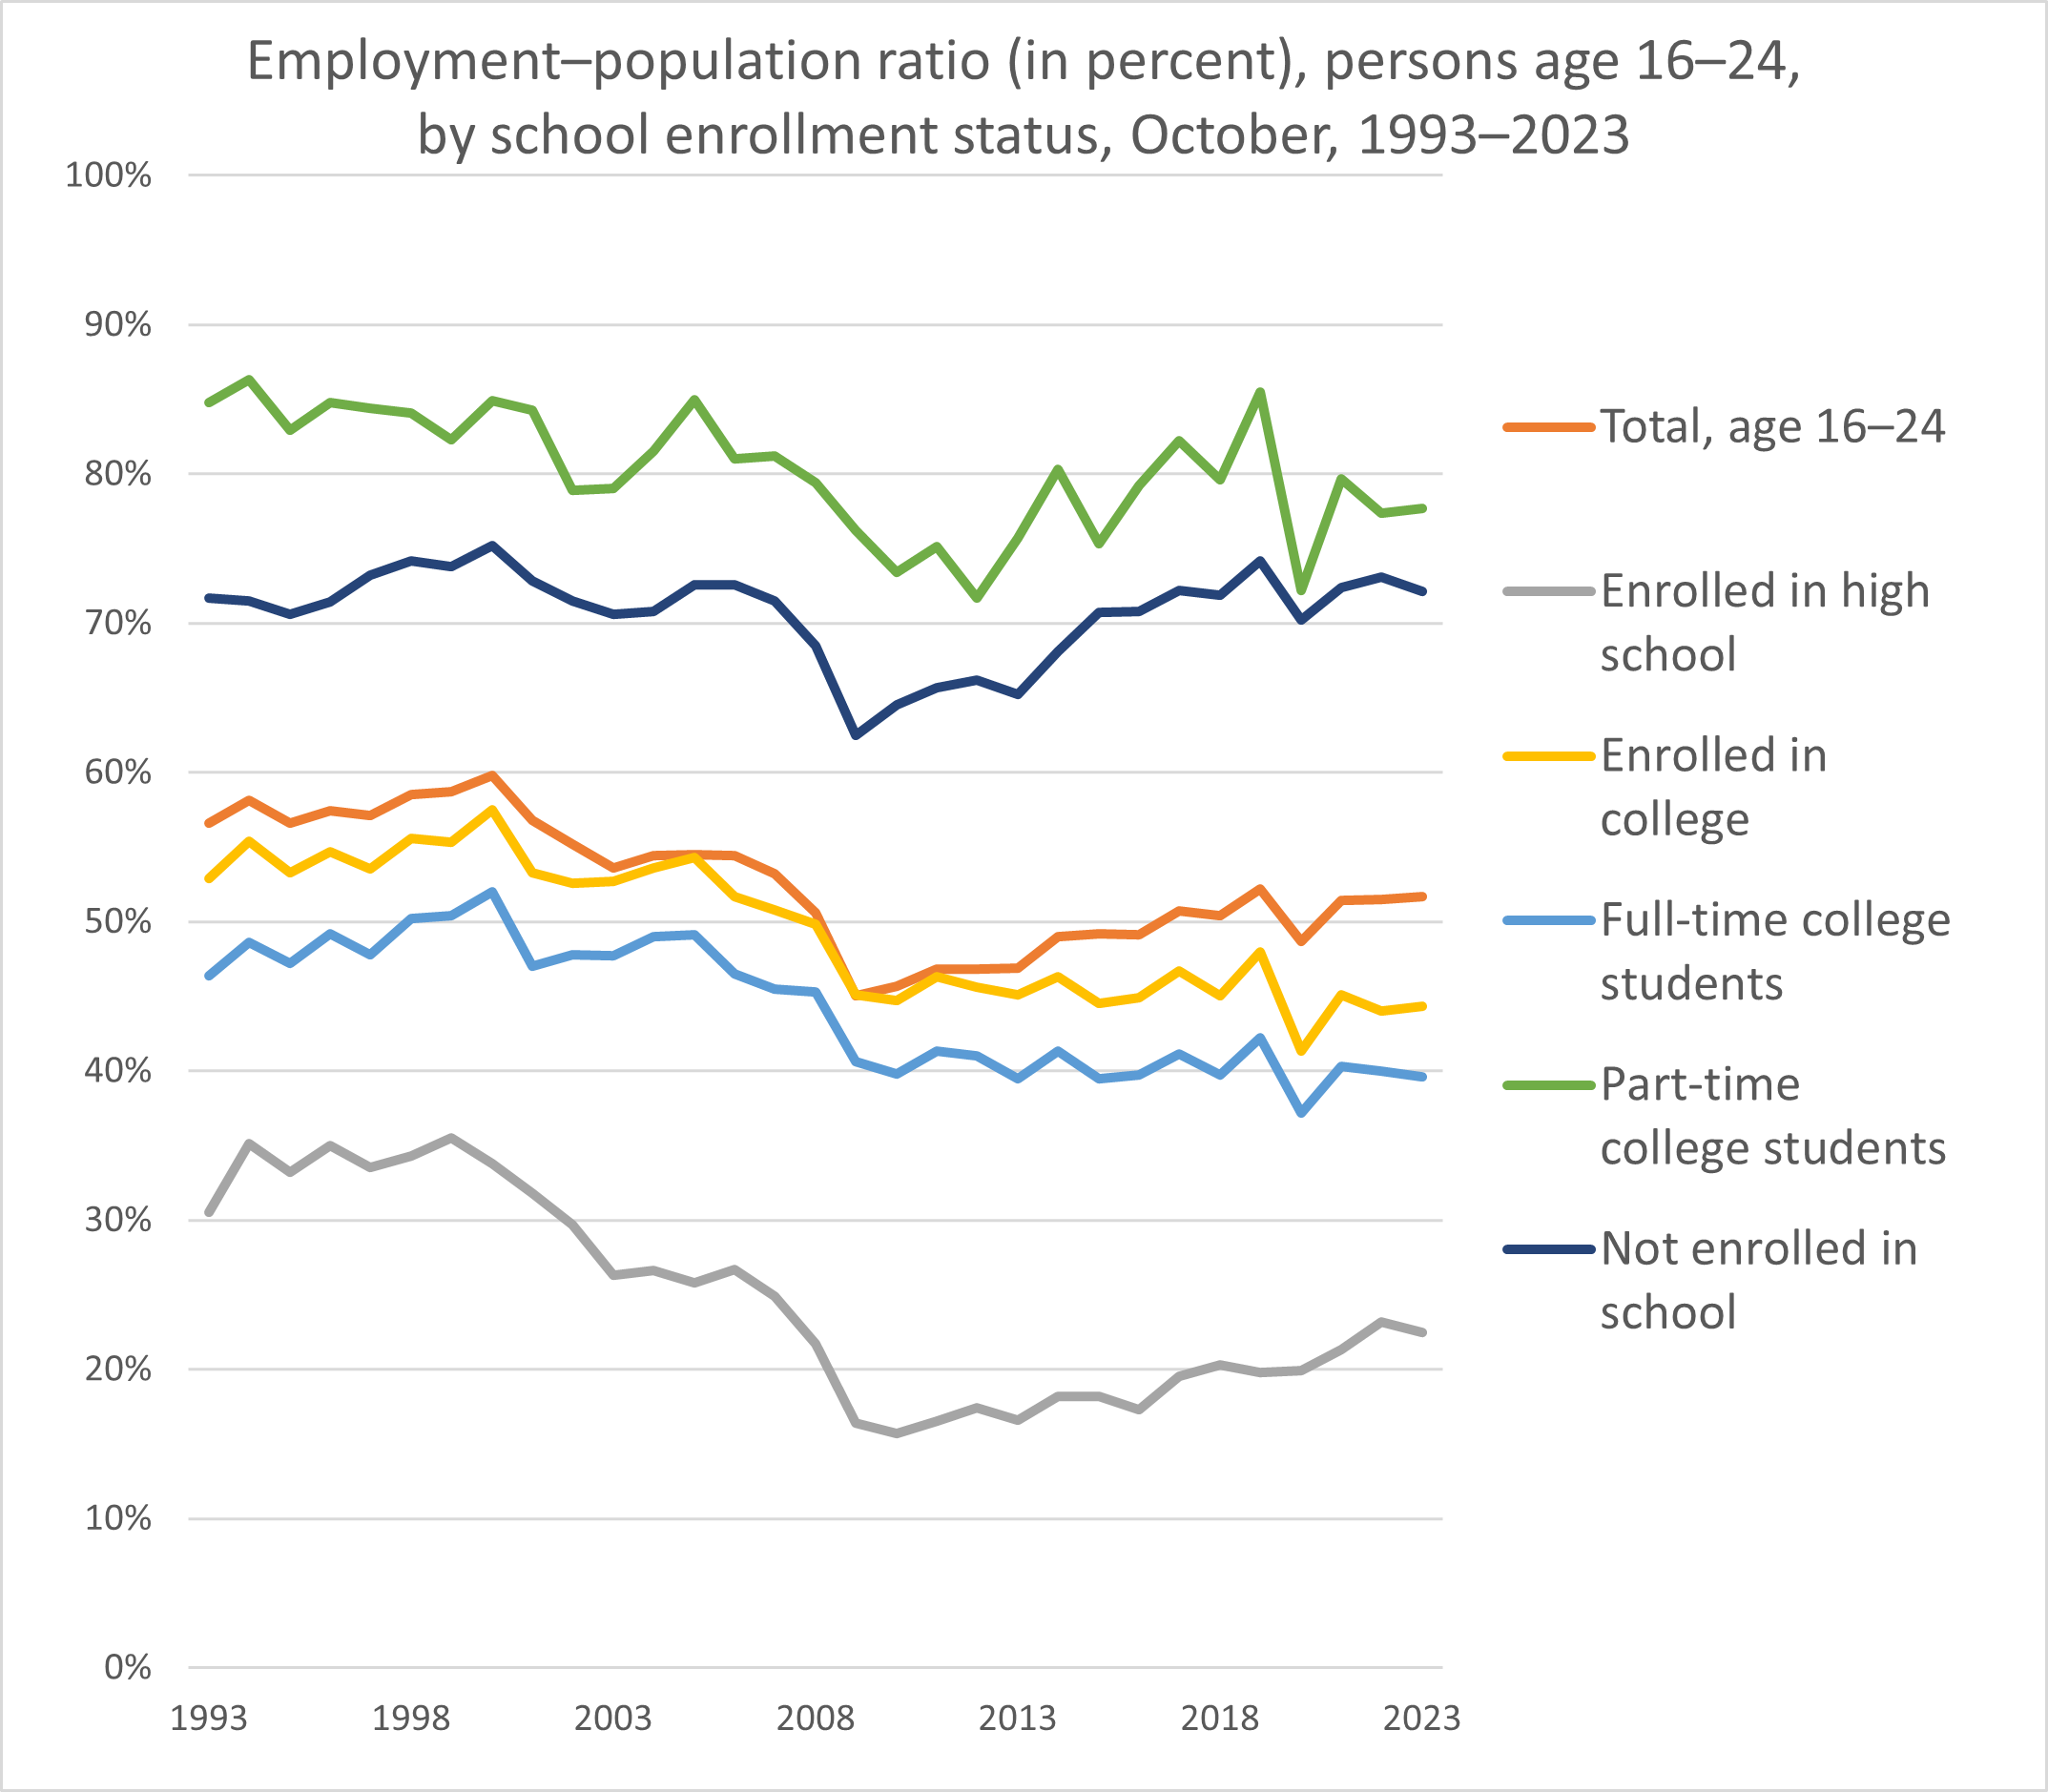
The U.S. employment-population ratio, or the percentage of the population that is employed, was 51.7 percent for the 16-24 age group in October of 2023. In the last 30 years, the ratio has climbed as high as 59.8 percent (2000) and dropped as low as 45 percent (2009), but these figures vary substantially when broken down by school enrollment status.
With summer ending and a new school year beginning, DEW hopes students are still thinking about their careers and staying aware of opportunities for employment. For more information on youth in the workplace, visit https://dew.sc.gov/youthemployment.
High School Students
The employment-population ratio for high school students peaked at 35.5 percent in 1999, declining over the next 11 years before hitting a low of 15.7 percent in 2010. The ratio rose steadily over the next decade and increased 0.1 percentage points between 2019 and 2020. This is the only group not to record a decrease from 2019 to 2020, but the 2023 ratio of 22.5 percent did drop from 23.2 percent the prior year.
College Students
For college students, the employment-population ratio has hovered around 45 percent since 2009. In 2023, the ratio was 44.3, making college students nearly twice as likely to be employed as high school students. The ratio for this group peaked in 2000 at 57.5 percent and was at its lowest in 2020 at 41.3 percent, down 6.7 points from the year before. Part-time college students were most likely to be employed in 2023, in line with historical trends. Their employment-population ratio was 77.7 percent in 2023. For full-time college students, this figure was just 39.6 percent. While the ratio for almost every group declined from 2019 to 2020, no group saw as large a decrease as part-time college students, whose ratio dropped over 13 points from 85.5 percent to 72.2 percent.
Unenrolled
Those not enrolled in school have historically been more likely to be employed than high school and full-time college students, but less likely than part-time college students. This group’s employment-population ratio peaked at 75.2 percent in 2000. Its lowest ratio was 62.5 percent in 2009. The ratio dropped four points from 2019 to 2020 and has not returned to pre-2020 levels, sitting at 72.1 percent for the year 2023.
Conclusion
The employment-population ratio for the 16-24 age group was highest at the turn of the century, but the ratio dropped over the next decade, and despite steady increases in the following years, it has not returned to previous levels. This may suggest that there is now greater competition for jobs that require fewer educational credentials, which high school and college students would likely seek. Additionally, full time academic enrollment clearly reduces the odds of employment, as high school and full-time college students are significantly less likely to be employed compared to part-time students and those who are not enrolled in school. For a visualization of this data, see the graph below.

