
Quarterly Census of Employment and Wages Data Analysis: Quarter Two, 2024
By Lainey Stalnaker, Data Analytics Writer

The Quarterly Census of Employment and Wages (QCEW) measures changes in employment, establishments, total wages, and average weekly wages at the national, state, and county levels. These data are collected through reports submitted by employers each quarter and categorized by sector according to the North American Industry Classification System (NAICS).[1] These data also include the monthly employment and quarterly wages for workers covered by state unemployment insurance (UI) laws and federal workers covered by the Unemployment Compensation for Federal Employees (UCFE) program, absent certain excluded groups.[2] DEW analyzed this employment-related information to better understand employment conditions and trends for our state. South Carolina continues to maintain record levels of employment and job opportunities.
Employment by County
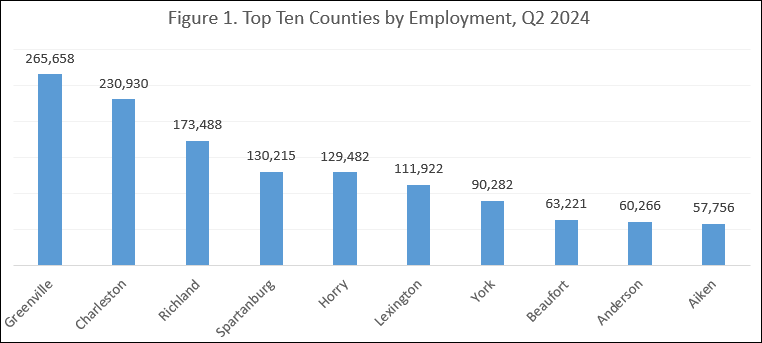
Employment in South Carolina reached 1,925,823 in June of 2024, an increase of over 25,000 South Carolinians in the workforce since March. Greenville County had the highest employment in the state at the end of quarter two with over 265,658 people employed, followed by Charleston and Richland Counties. Horry County, which had the fifth highest employment in the state, increased employment by 6.0 percent from the end of quarter one to the end of quarter two, gaining over 7,000 jobs—more than any other county in the state. See Figure 1 for the counties with the highest employment.
Employment by Industry
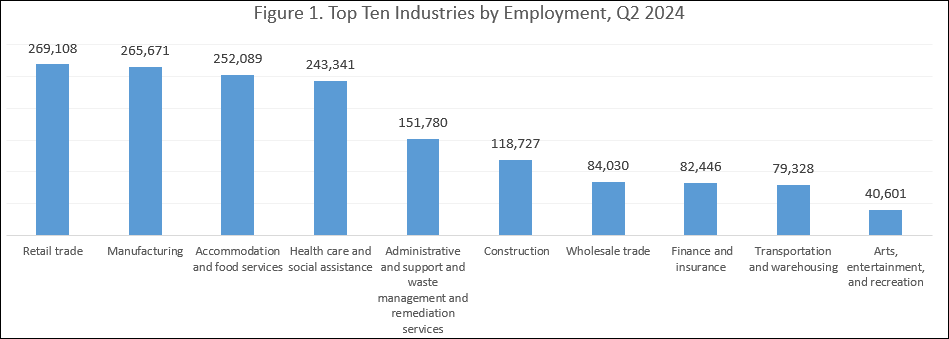
The largest employers by industry were retail trade; manufacturing; and accommodation and food services, the same as quarter one. Retail trade employed 269,108 people in June of 2024, an increase of over 4,000 since March. Manufacturing increased employment by about 1,800, reaching 265,671 in June, and accommodation and food services employed 252,089 people in June, increasing by over 8,700 since March, the most of any industry. Figure 2 details employment data for the ten largest industries in the state
Wages by County
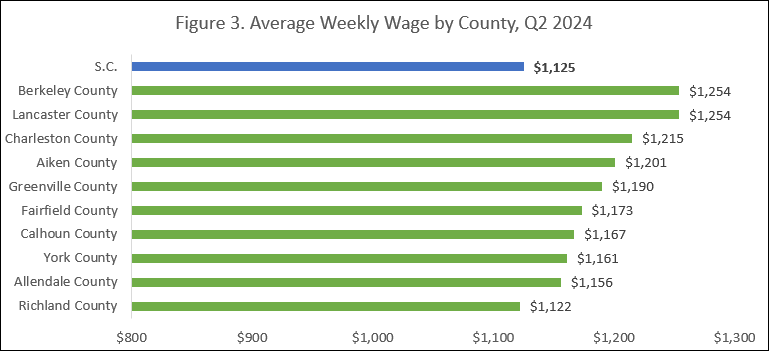
Average weekly wages in South Carolina fell to $1,125 in quarter two of 2024, down from $1,198 in quarter one. At 6.1 percent, this was less severe than national trends, where U.S. weekly wages dropped 10.5 percent from $1,549 to $1,384 over the second quarter of 2024. This sort of decline is not unusual for this time of year—average weekly wages fell between quarters one and two in nine of the last ten years in South Carolina. Some counties felt the effects more acutely than others. Of the 48 counties in the state, 34 recorded a decrease of 1.0 percent or more. Just seven increased by 1.0 percent or more. Rural Allendale County reported the largest gains, with average weekly wages increasing 8.4 percent over the quarter, while Berkeley County saw wages decrease by 12.3 percent, the steepest drop.
Despite this drop, Berkeley County still recorded the highest average weekly wage in South Carolina, tying with Lancaster County at $1,254. Charleston County came in third with an average weekly wage of $1,215. The lowest average wages were reported in Clarendon County ($681), Dillon County ($759), and McCormick County ($783). See Figure 3 for a breakdown of where wages were highest in the state.
Wages by Industry
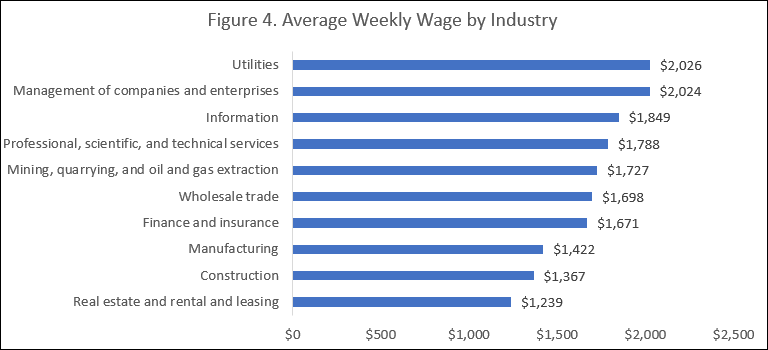
Utilities had the highest average weekly wage in quarter two at $2,026, down from $2,445 in quarter one. Management of companies and enterprises came in second at $2,024, followed by information at $1,849. Accommodation and food services again had the lowest wages with an average of $476 per week, followed by arts, entertainment, and recreation ($502), and then retail trade ($731). Figure 4 identifies the industries with the highest wages in the state.
[1] https://www.bls.gov/news.release/cewqtr.htm
[2] For more information on the workers excluded from coverage, see https://www.bls.gov/cew/publications/employment-and-wages-annual-averages/current/home.htm#exclusions.