
Job Separations in South Carolina in 2024
By Lainey Stalnaker, Data Analytics Writer

The Job Openings and Labor Turnover Survey (JOLTS), conducted by the Bureau of Labor Statistics (BLS) each month, collects data on job openings, hires, and separations at both the national and state level. These data are available for all nonfarm establishments and are seasonally adjusted.[1]
Separations are divided into quits, layoffs and discharges, and other separations. Quits include voluntary separations from employment but exclude retirements. Layoffs and discharges include involuntary separations initiated by the employer, such as discharges for cause and layoffs resulting from downsizing, mergers, or closings. Separations data from 2023 through 2024 reflect that the post-pandemic quits rate has slowed while layoffs and discharges have increased slightly.
Quits
Following the pandemic, the number of people quitting their jobs rose sharply—in November of 2021, a high of 81,000 workers in South Carolina quit their jobs. In the last two years, however, quits levels have declined. In 2023, quits averaged 69,000 a month. Between January and November of 2024, the average fell to 64,000, a difference of 5,000 people each month, as shown in Figure 1.
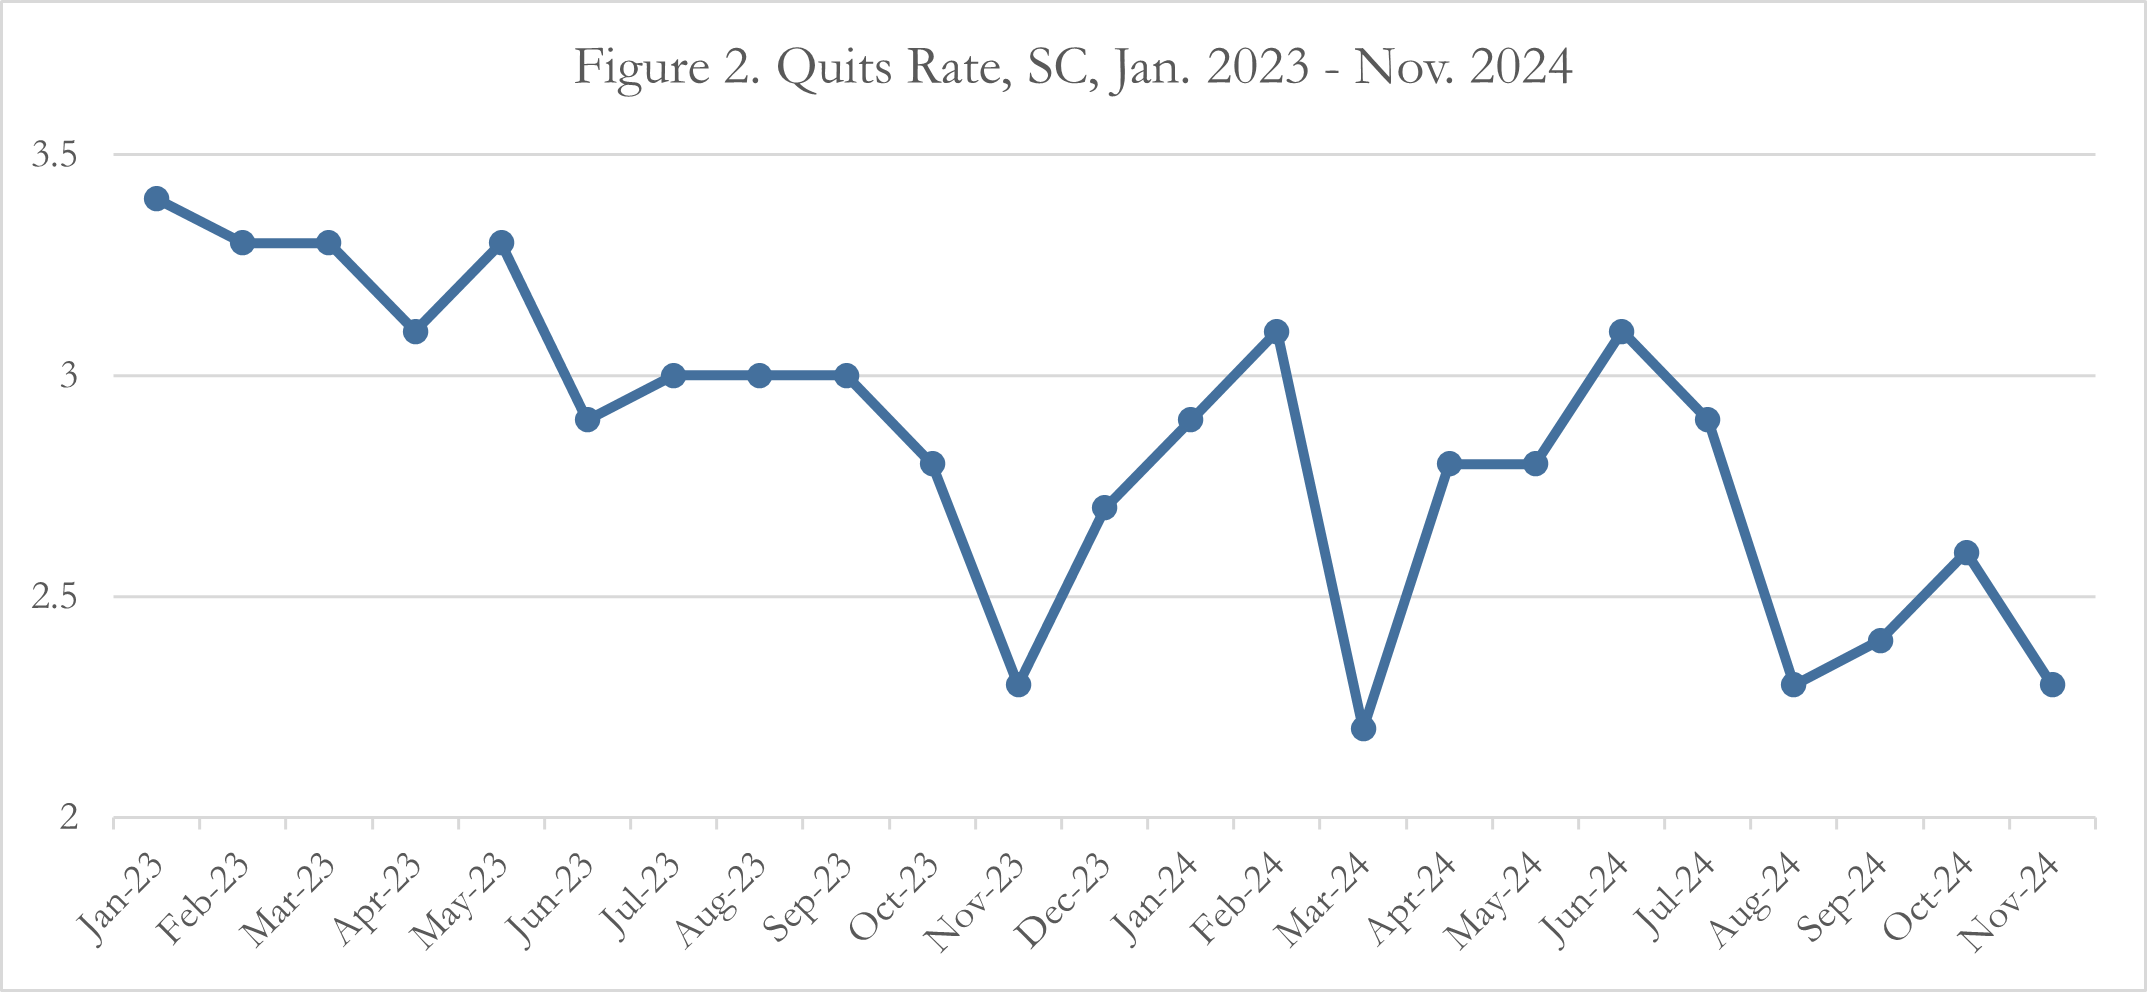
The quits rate, which measures quits as a proportion of employment, also declined between 2023 and 2024. In January of 2023, the quits rate was 3.4, but dropped rapidly at the end of the year. After spiking again in January of 2024, the rate hit a nearly four-year low of 2.2 in March. The rate rose slightly before dropping again in the second half of 2024 and fell to 2.3 in November, as shown in Figure 2. Despite fluctuations, the quits rate has trended down, suggesting that workers are less inclined to leave their jobs now than they were two years ago.
Figure 1. Quits Levels, SC, Jan 2023-Nov 2024 (thousands) | ||||||||||||
| Year | Jan | Feb | Mar | Apr | May | Jun | Jul | Aug | Sep | Oct | Nov | Dec |
| 2023 | 77 | 75 | 76 | 70 | 75 | 67 | 68 | 69 | 69 | 65 | 54 | 64 |
| 2024 | 68 | 74 | 53 | 66 | 67 | 73 | 70 | 55 | 57 | 62 | 55(P) | |
Layoffs and Discharges
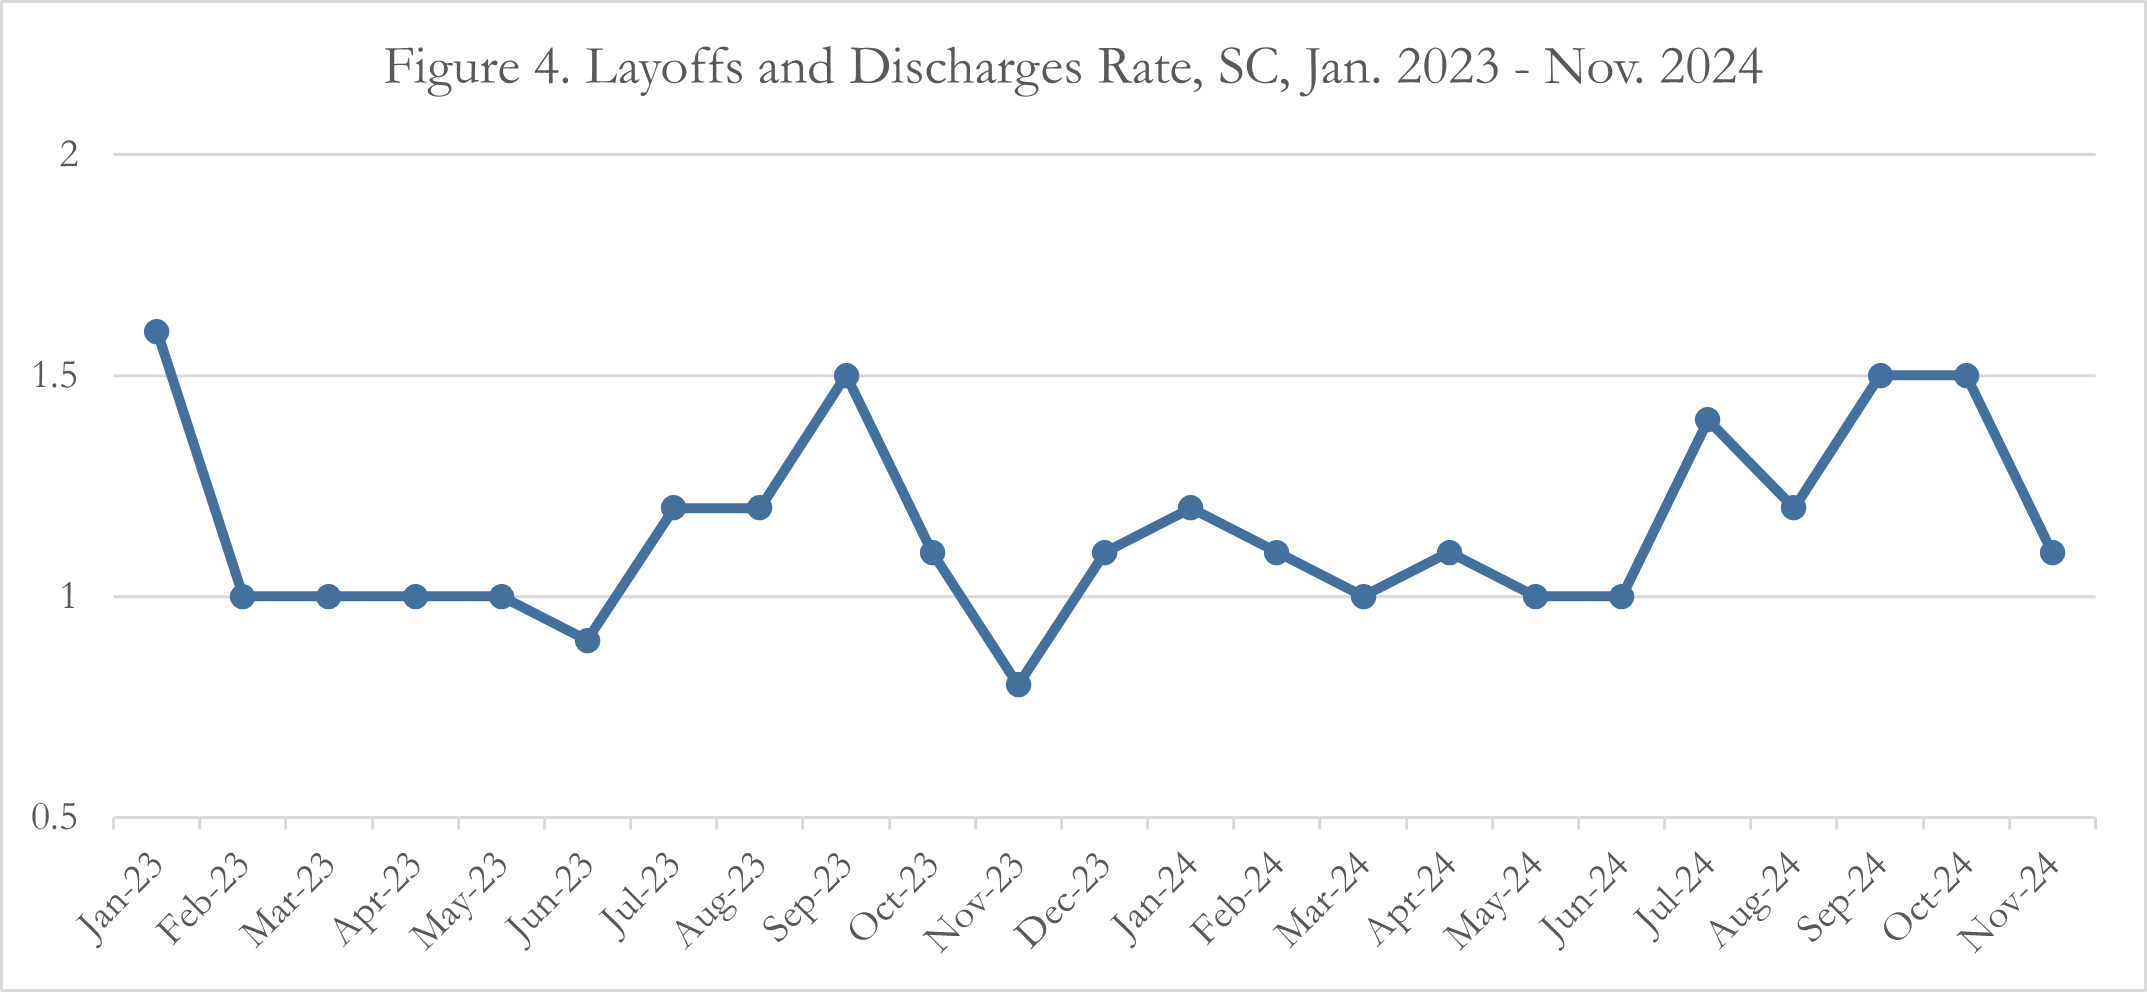
Unlike quits, layoffs and discharges levels have wavered little in the last two years. In 2023, layoffs and discharges averaged 26,000 per month. In 2024, the average increased to 28,000 per month. Layoffs dropped as low as 23,000 in 2024—but there was a slight uptick later in the year, with 37,000 people being laid off in September and 35,000 in October, as seen in Figure 3. Layoffs dropped again in November—to 26,000. Figure 4 shows the rate of layoffs and discharges (which is calculated similarly to the quits rate) since January of 2023. The rate has remained at historically low levels, with only marginal shifts. The rate hit a twelve-month peak of 1.5 in September and October but dropped to 1.1. in November, further indicating a reduction in turnover in the labor market.
| Figure 3. Layoffs and Discharges Levels, SC, Jan 2023-Nov 2024 (thousands) | ||||||||||||
| Year | Jan | Feb | Mar | Apr | May | Jun | Jul | Aug | Sep | Oct | Nov | Dec |
| 2023 | 36 | 23 | 24 | 24 | 24 | 21 | 27 | 27 | 35 | 26 | 19 | 25 |
| 2024 | 29 | 25 | 24 | 25 | 23 | 24 | 33 | 28 | 37 | 35 | 26(P) | |
[1] https://www.bls.gov/news.release/pdf/jltst.pdf