
Quarterly Census of Employment and Wages: Quarter Three, 2024
By Lainey Stalnaker, Data Analytics Writer

The Quarterly Census of Employment and Wages (QCEW) measures changes in employment, establishments, total wages, and average weekly wages at the national, state, and county levels. Data are categorized by sector according to the North American Industry Classification System (NAICS).[1] These data include the monthly employment and quarterly wages for workers covered by state unemployment insurance (UI) laws and federal workers covered by the Unemployment Compensation for Federal Employees (UCFE) program, absent certain excluded groups.[2] The average weekly wages and employment in South Carolina varied widely by industry and county in the third quarter of 2024 (Q3 2024) , marking a period of fluctuation amidst long-term growth in both wages and employment across the state.
South Carolina Employment by Industry
Private sector employment in South Carolina fell to 1,926,417 during Q3 2024, a decline of 0.5 percent from three months earlier, or a loss of 10,352 jobs. Despite this short-term drop, employment still increased 1.5 percent over the prior 12 months.
Retail trade employed the most people in the state in September of 2024, at 266,598. Manufacturing ranked second, employing 263,672 people, followed by health care and social assistance, which employed 247,234 people.
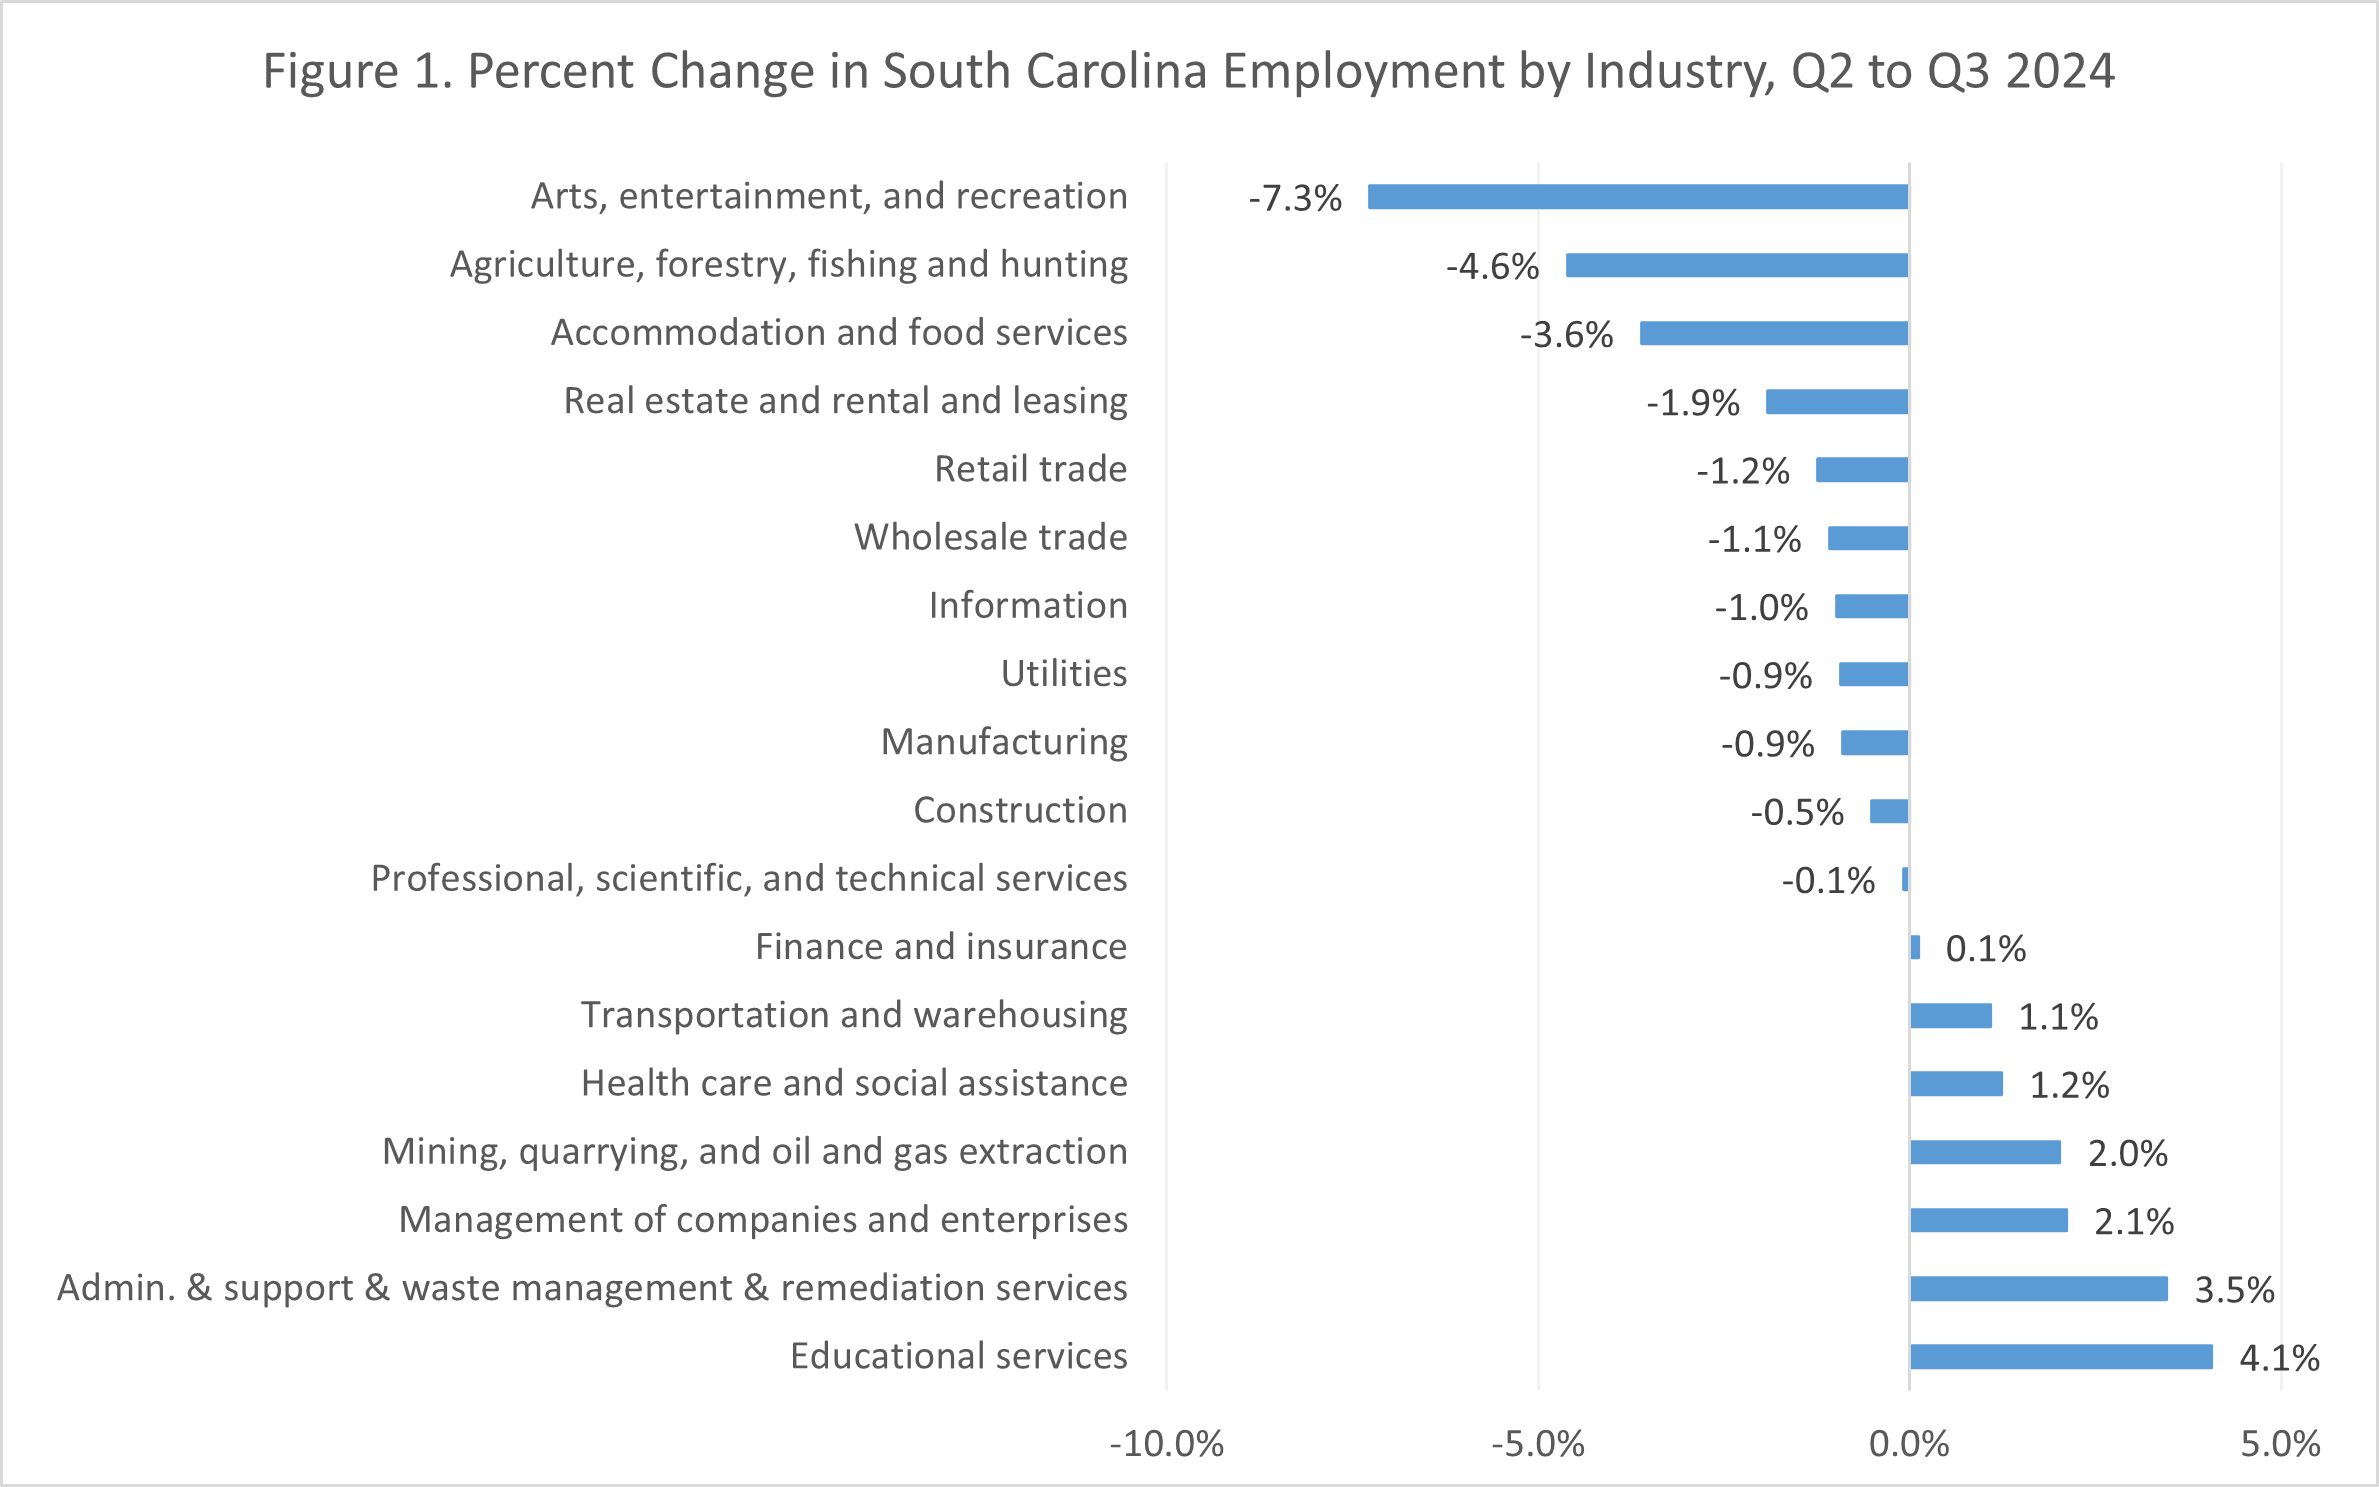
Seven of 18 industries recorded employment growth in Q3 2024. Educational services topped the list with a 4.1 percent gain, followed by administrative and support and waste management and remediation services at 3.5 percent, and management of companies and enterprises at 2.1 percent. Altogether, these three industries created nearly 10,000 new jobs. Employment in arts, entertainment, and recreation fell the most—7.3 percent—followed by agriculture, forestry, fishing, and hunting with a 4.6 percent reduction in employment. Accommodation and food services accounted for the most jobs lost numerically—9,168, a 3.6 percent drop from Q2 to Q3. Figure 1 shows percent change in employment from quarter two to quarter three within each industry.
South Carolina Employment by County
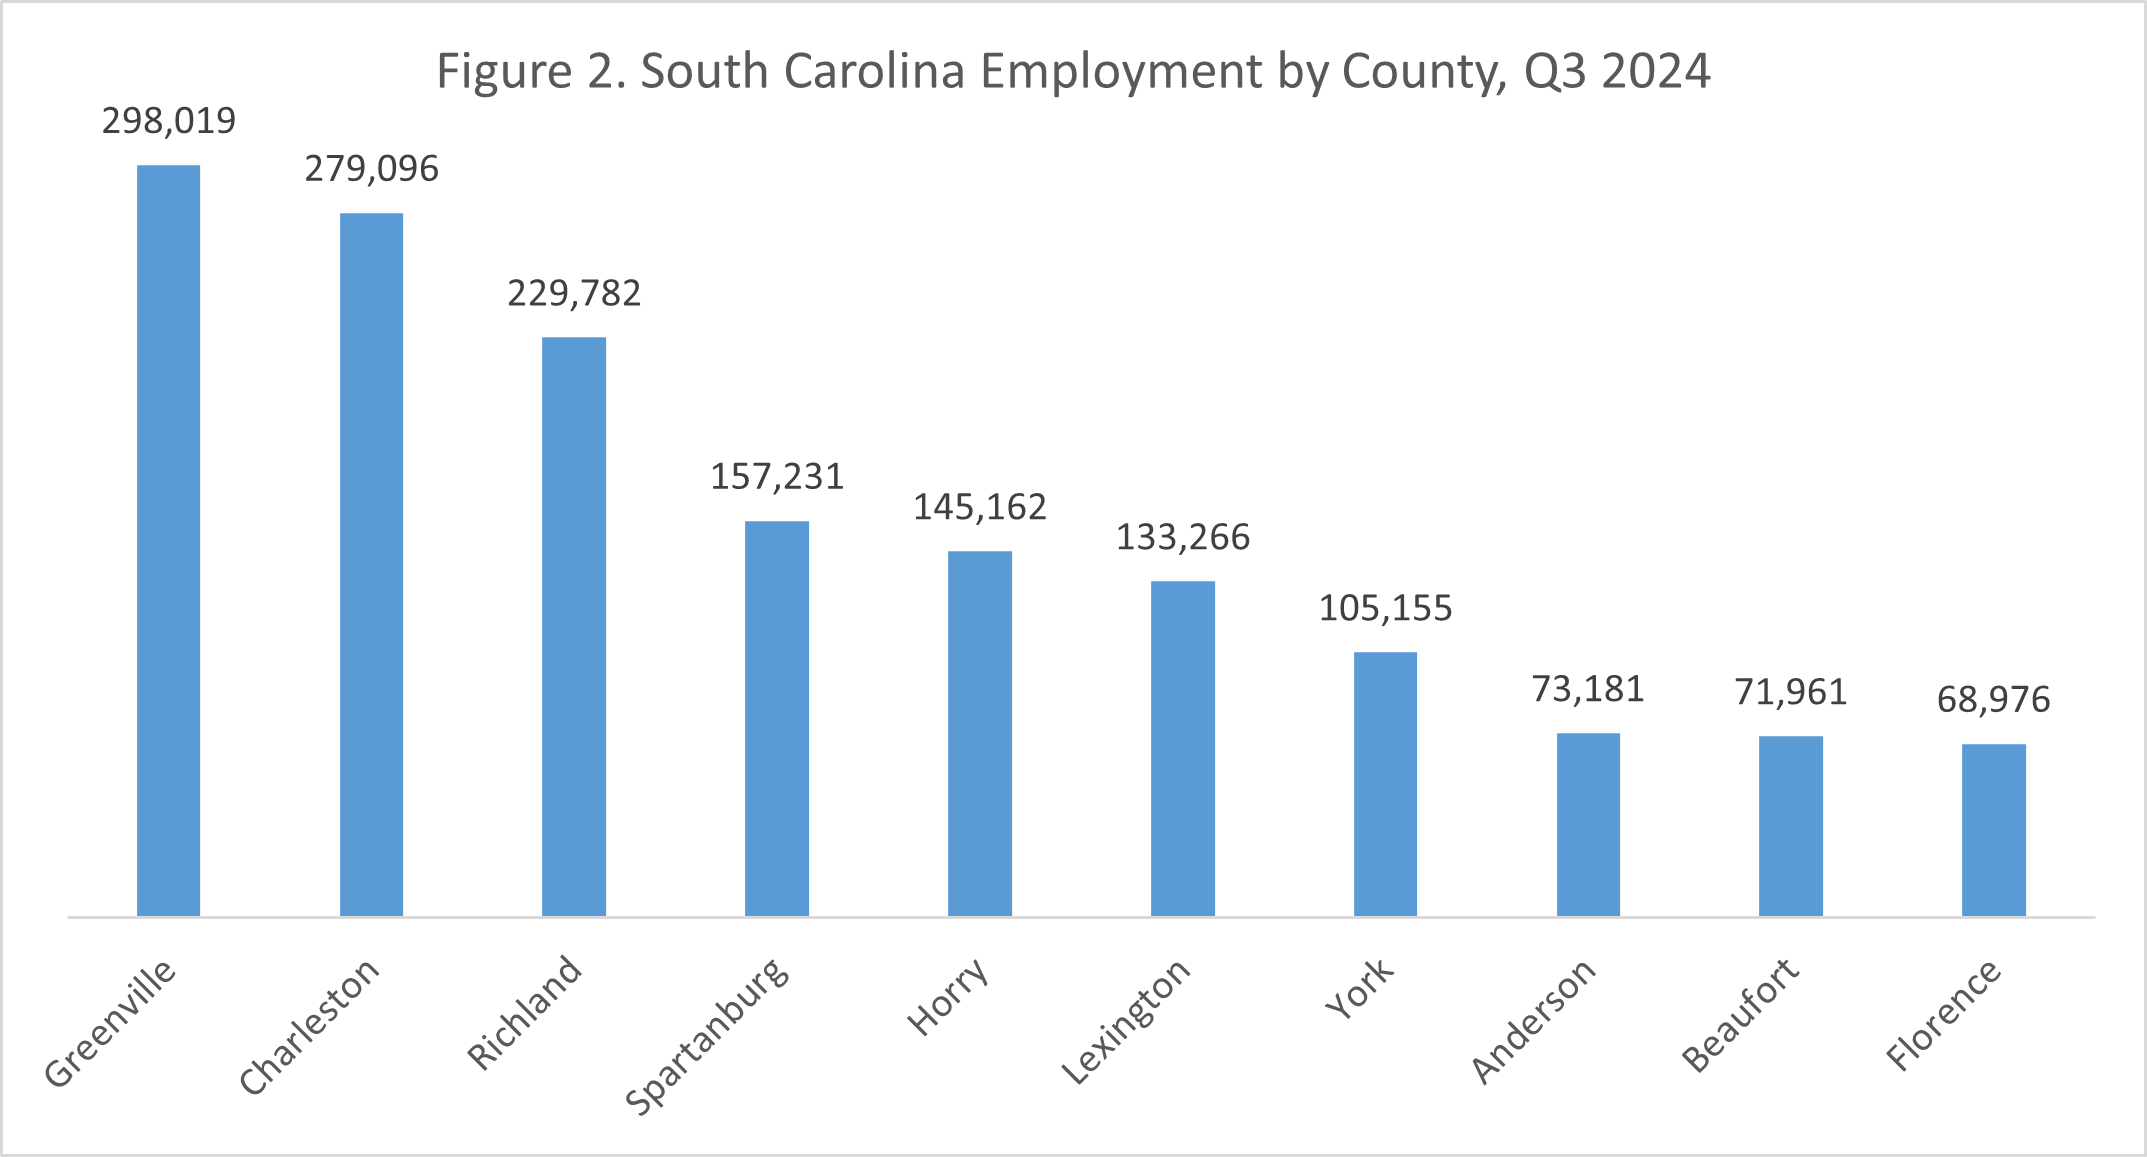
In Q3 2024, total employment was highest in Greenville County, Charleston County, and Richland County, the same as in the previous two quarters. Of these three counties, Richland was the only one to record employment growth from quarter two to quarter three. It topped the list of 20 counties recording growth over the quarter, adding 2,812 jobs. Pickens County and Lexington County increased employment by 2,763 and 1,105, respectively. Employment gains were concentrated in the Midlands and parts of the Upstate while the biggest losses occurred along the coast.
Horry County, which grew employment the most from quarter one to quarter two, recorded the largest decline in employment at the end of quarter three, losing nearly 5,000 jobs. Nearly 3,000 fewer people were employed in Charleston County in quarter three, and 2,300 fewer people were employed in Beaufort County. Fluctuations in the seasonal job market are most certainly the cause—in all three of these counties, the majority of losses came in the accommodations and food service sector. All three counties, however, remained in the top ten for employment, as shown in Figure 2.
South Carolina Wages by Industry
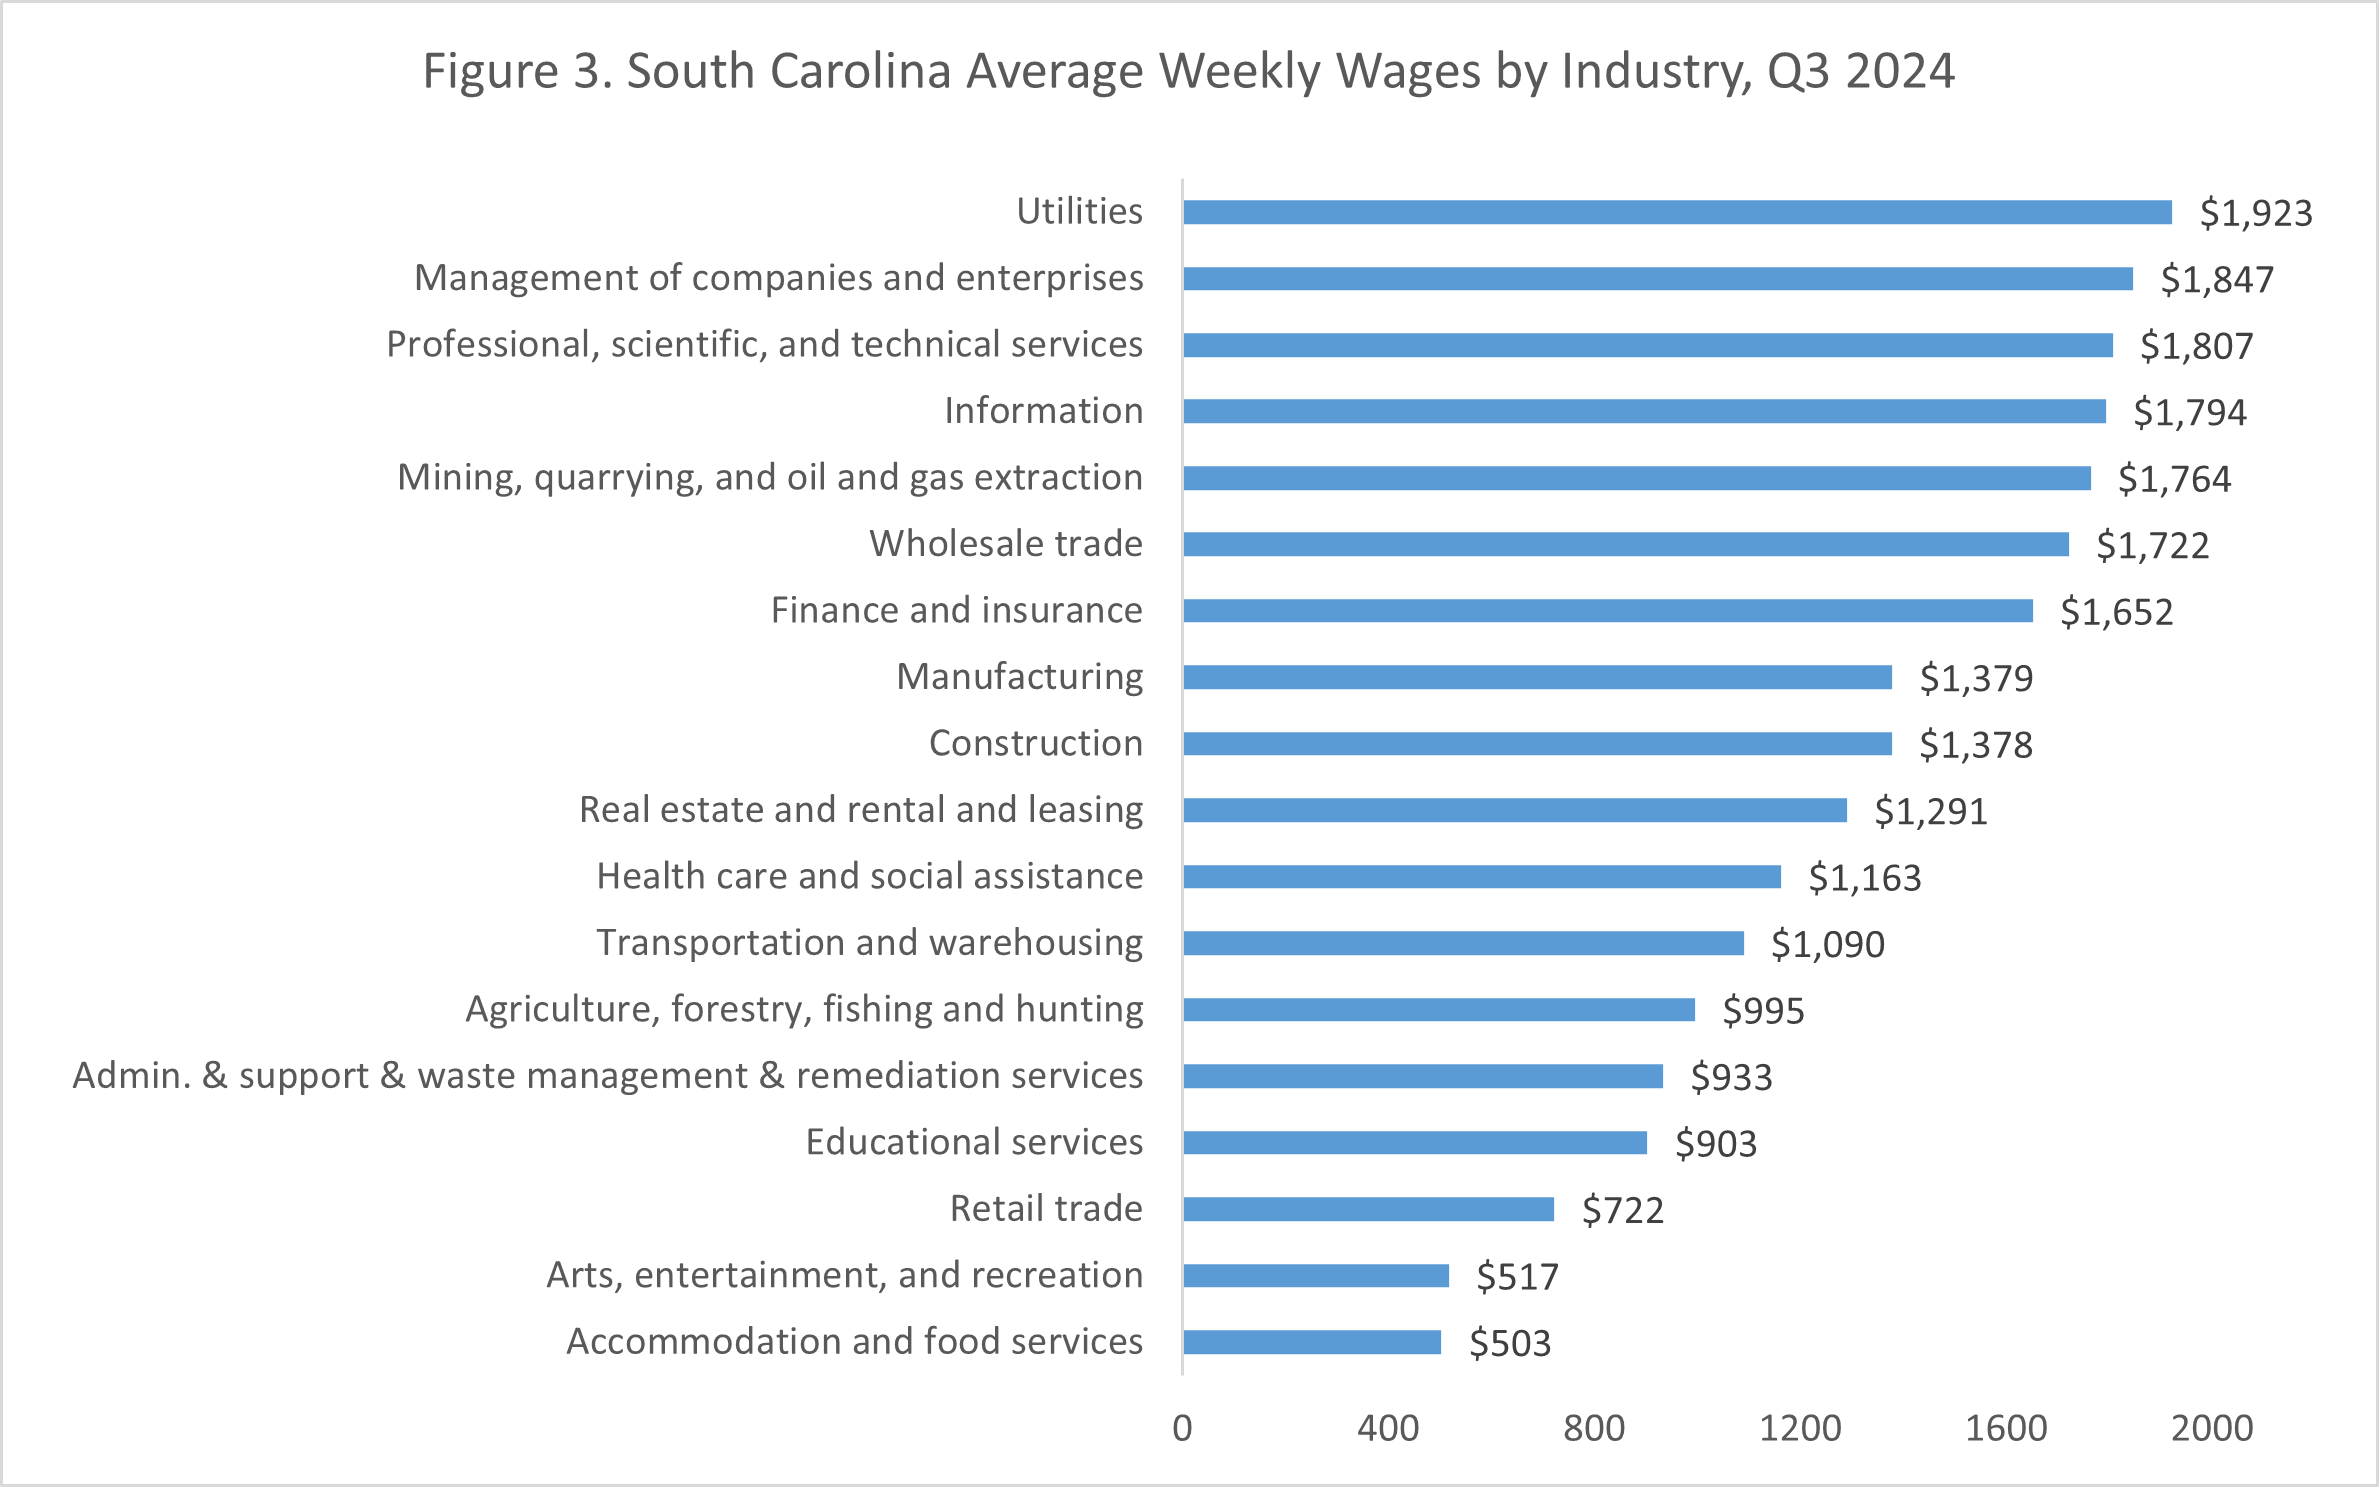
In Q3 2024, utilities again recorded the highest average weekly wage at $1,923, followed by management of companies and enterprises at $1,847. Though these two sectors maintained the highest wages, they also reported the steepest declines from the previous quarter. The average for utilities fell by $102, or 5.0 percent. For management of companies and enterprises, wages fell by $173, or 8.6 percent. Five other industries recorded shrinking wages in quarter three: manufacturing (-3.0 percent), information (-1.9 percent), educational services (-1.1 percent), finance and insurance (-1.0 percent), and administrative and support and waste and remediation services (-0.2 percent). Transportation and warehousing wages remained unchanged.
The biggest gains were recorded in real estate and rental and leasing, which saw average weekly wages grow by 4.8 percent—from $1,232 to $1,291. Agriculture, forestry, and fishing wages increased from $962 to $995, or 3.4 percent, and arts, entertainment, and recreation wages increased by 3.2 percent from $501 to $517. See Figure 3 for a breakdown of average weekly wages in each industry in quarter three.
South Carolina Wages by County
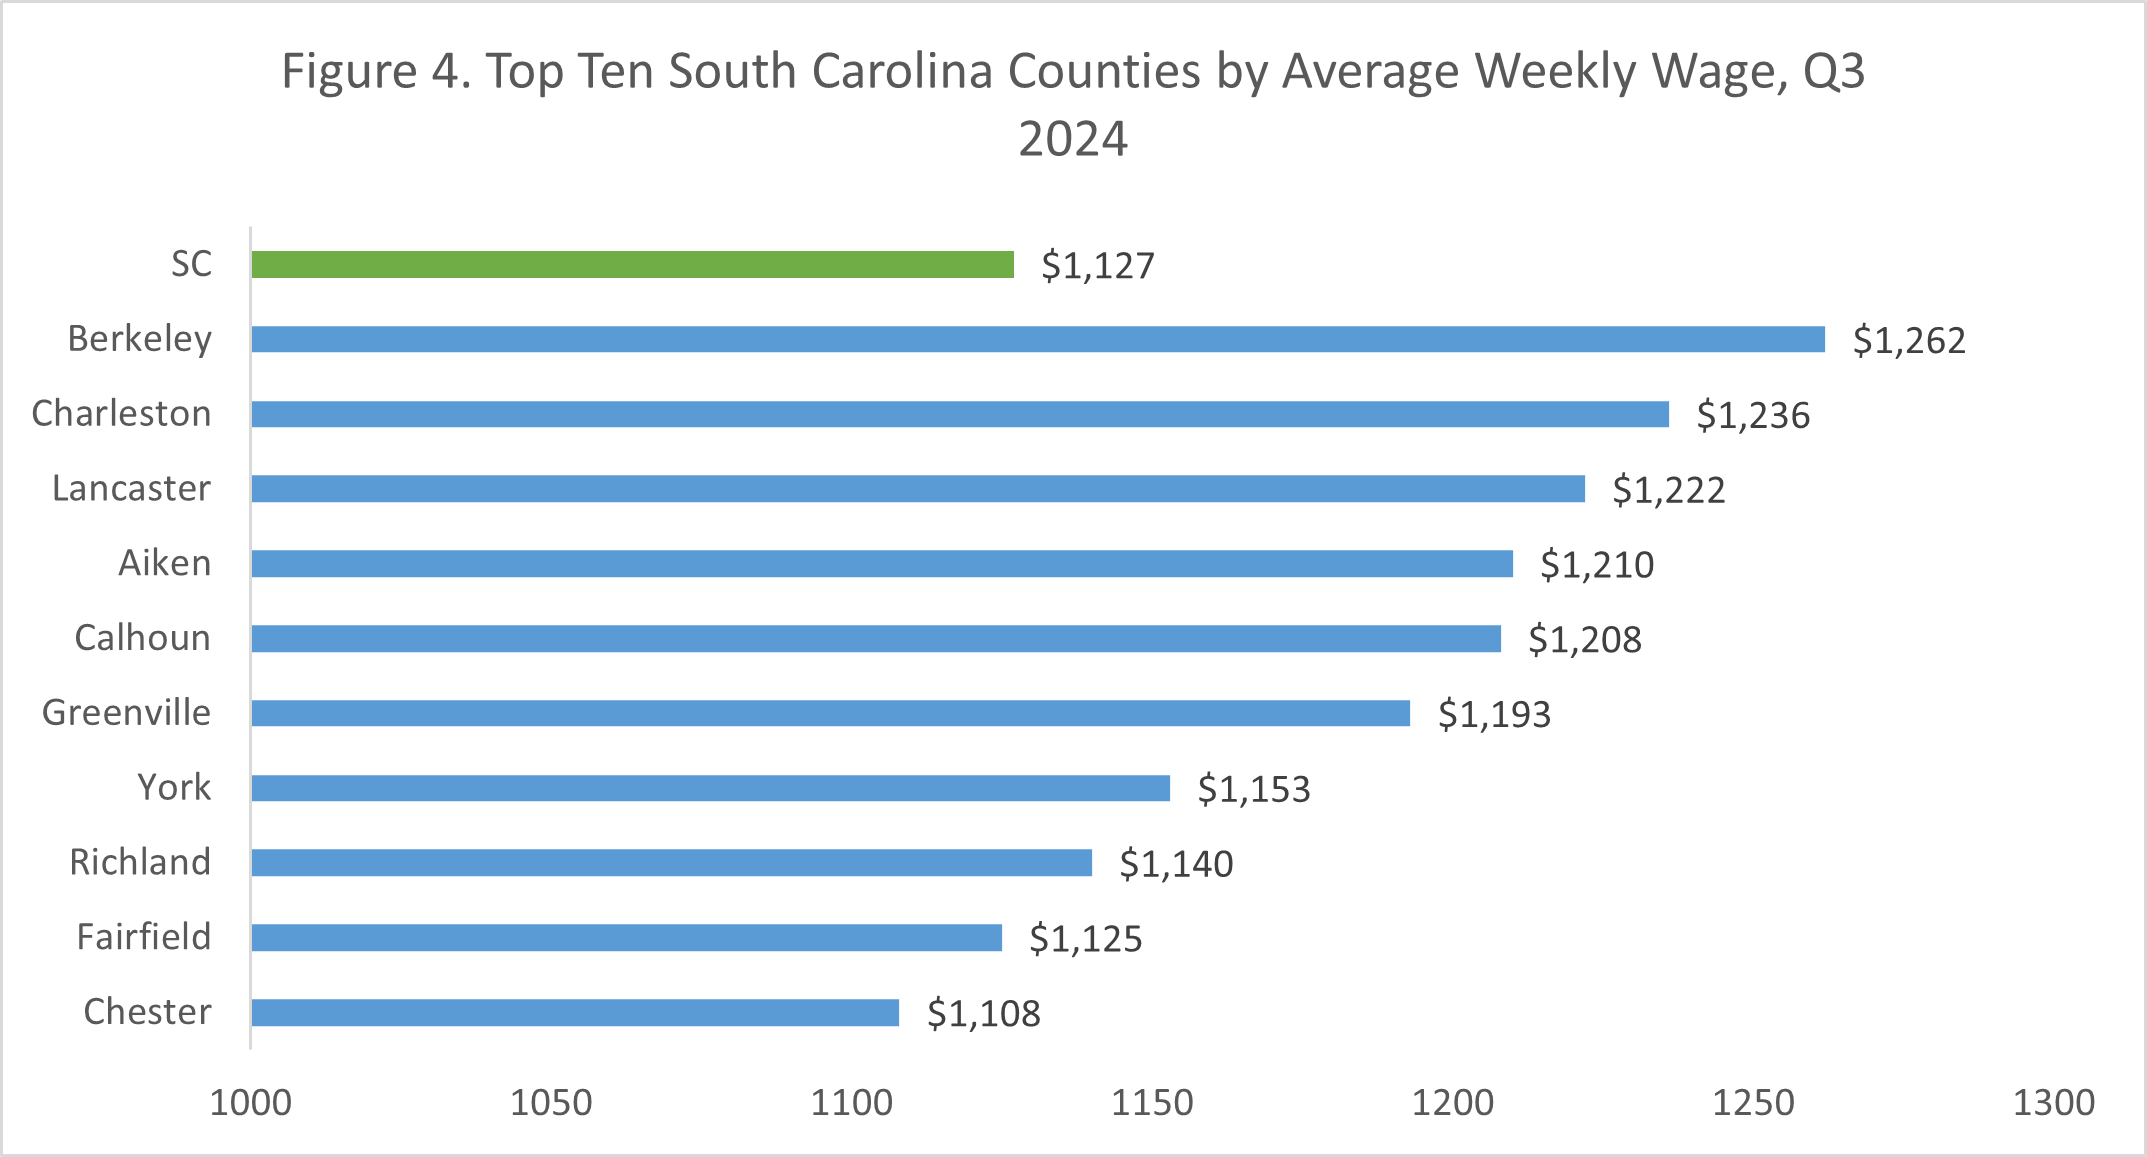
At the state level, average weekly wages increased only marginally—from $1,123 to $1,127. The highest wages were recorded in Berkeley County at $1,262, Charleston County at $1,236, and Lancaster County at $1,222, as shown in Figure 4. At $687, Clarendon County recorded the lowest average weekly wages, followed by McCormick County and Barnwell County.
Wages increased in 27 of 46 counties in quarter three. Dillon County recorded the fastest growth, with wages increasing 10.3 percent from quarter two to quarter three, or by $78. Wages in Bamberg increased 7.2 percent, and in Kershaw, wages increased 5.1 percent. Wages fell 10.5 percent in Allendale County, from $1,154 to $1,033, a difference of $121. Also in the bottom five, wages decreased 6.8 percent in McCormick County, 6.1 percent in Marlboro County, 5.1 percent in Spartanburg County, and 3.8 percent in Jasper County.
[1] https://www.bls.gov/cew/
[2] For more information on the workers excluded from coverage, see https://www.bls.gov/cew/publications/employment-and-wages-annual-averages/current/home.htm#exclusions.