
Job Openings and Labor Turnover, April 2025
By Lainey Stalnaker, Data Analytics Writer

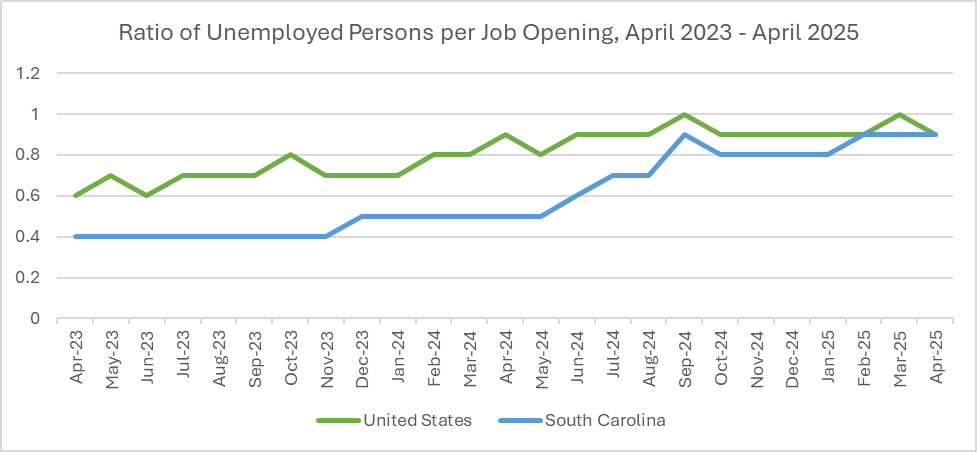
The Job Openings and Labor Turnover Survey (JOLTS), released monthly by the Bureau of Labor Statistics (BLS), provides essential information on South Carolina’s labor market.[1] In April of 2025, South Carolina’s unemployed persons per job opening ratio remained unchanged at 0.9, equal to the national average.
The table below compares unemployed persons per job opening ratios in the Southeast Region.[2] There is less than one unemployed person per job opening in all states in the region except Florida and Kentucky.
| Regional Job Openings ratios | ||||||||
KY | TN | NC | SC | GA | FL | AL | MS | ||
| APRIL 2025 | 1.1 | 0.7 | 0.6 | 0.9 | 0.7 | 1.1 | 0.7 | 0.8 | |
| APRIL 2024 | 0.7 | 0.5 | 0.7 | 0.5 | 0.6 | 0.7 | 0.6 | 0.5 | |
Other key statistics released in the monthly JOLTS report include:
- Job openings rate: the number of positions open during the month as a percentage of all jobs and job openings.
- Hires rate: the number of people hired during the month as a percentage of total employment.
- Separations rate: the number of people separated from their jobs during the month as a percentage of total employment. The quits rate is the proportion of people who voluntarily left their jobs, and the layoffs and discharges rate is the proportion of people who involuntarily left their jobs, which may have resulted from business closures, layoffs, downsizing, or firing for cause. Separations resulting from retirements, transfers, or deaths are included in the total separations rate.
| JOLTS Key Ratio Statistics, APRIL 2025 | ||||||||
KY | TN | NC | SC | GA | FL | AL | MS | ||
| Job Openings RATE | 4.6 | 4.7 | 5.7 | 4.9 | 4.9 | 3.7 | 4.9 | 4.9 | |
| HireS Rate | 3.9 | 3.5 | 4.4 | 4.4 | 3.4 | 3.8 | 3.8 | 3.7 | |
| Total SeparationS Rate | 3.5 | 3.6 | 3.1 | 3.5 | 3.2 | 4.0 | 3.2 | 3.6 | |
| QuitS Rate | 1.9 | 2.2 | 1.6 | 2.2 | 1.7 | 2.4 | 1.9 | 2.2 | |
| LayoffS Rate | 1.3 | 1.3 | 1.2 | 1.1 | 1.3 | 1.5 | 1.0 | 1.2 | |
In April of 2025, the layoffs and discharges rate increased across the South and is now 1.0 or higher in all seven states in the region. South Carolina had the second lowest layoffs rate at 1.1. At 1.5, Florida had the highest rate, up 0.4 points from March.
Most states, including South Carolina, also recorded decreases in the quits rate, tempering the effects of increased layoffs on the total separations rate. Still, April saw elevated turnover in the job market.
The job openings and hires rates both increased in South Carolina from March to April, pointing to continued job growth, even as some employers are laying off staff. South Carolina’s job openings rate tied for second highest in the South at 4.9, and the hires rate tied for highest in the region at 4.4.
[1] https://www.bls.gov/news.release/jltst.nr0.htm
[2] The Southeast Region is defined by the Department of Labor and includes Alabama, Georgia, Florida, Kentucky, Mississippi, North Carolina, South Carolina, and Tennessee.