MyBenefits
Apply for and certify your claim here.
 The Official Web Site of the State of South Carolina
South Carolina’s Employment Situation
January 2019
Job Growth Remains Stout
Unemployment Rate Unchanged
The number of individuals working across the state increased substantially, by an estimated 5,582 people, marking a new record of 2,260,509 for the Palmetto State.
Unemployment estimates showed little change over the month, decreasing by 421 to 74,823 people. The state’s labor force increased by 5,161 to 2,335,332 people, as the almost all of jobseekers entering the labor force found jobs.
The state’s seasonally adjusted unemployment rate remained unchanged at 3.2 percent from the revised December 2018 rate of 3.2 percent.
Since January of 2018, employment gains moved notably higher by approximately 35,251 people, and the labor force estimate rose by 19,237 people. The level of unemployed moved significantly lower by roughly 16,014 people.
Nationally, the unemployment rate increased to 4.0 percent from December’s estimate of 3.9 percent.
Nonagricultural Employment by Industry (Seasonally Adjusted1)
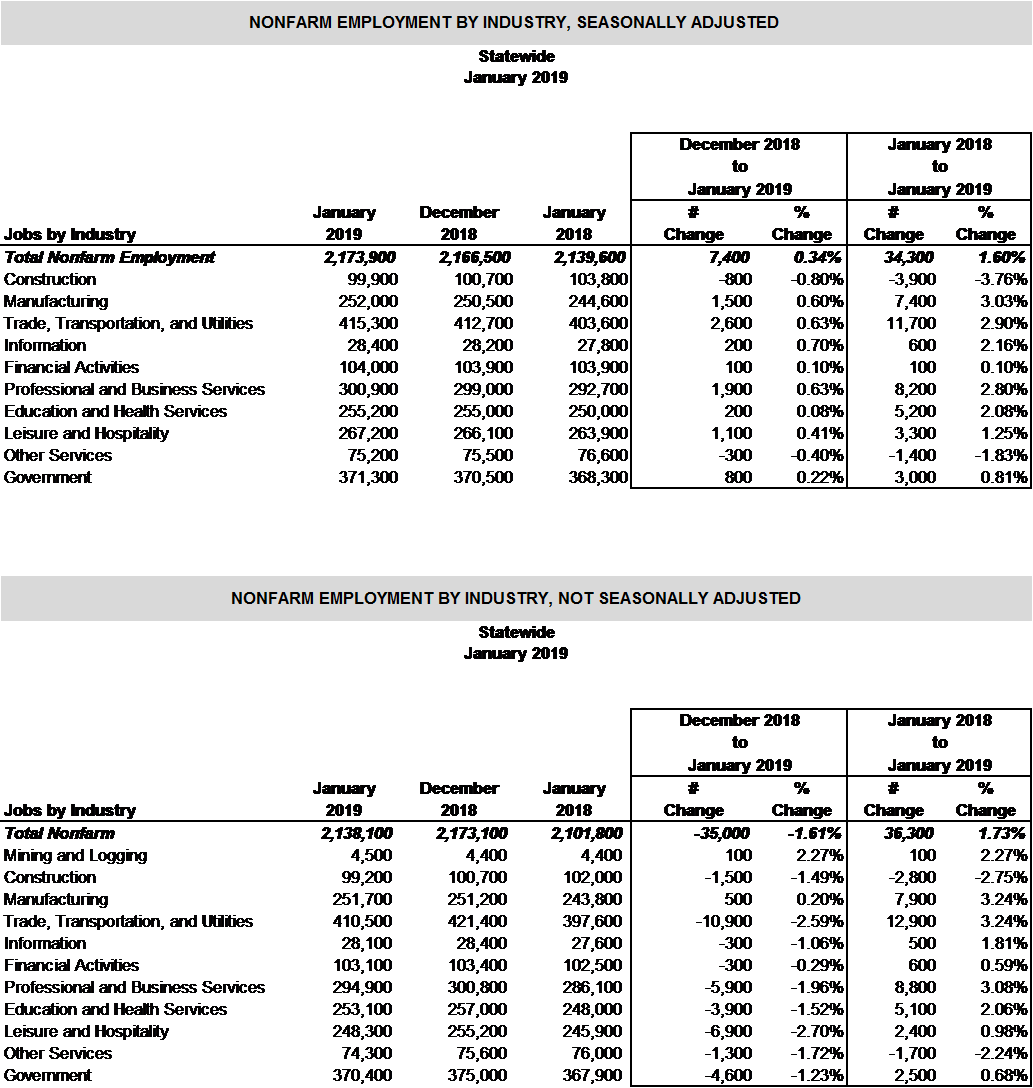
In January 2019, seasonally adjusted, nonfarm payrolls increased by 7,400 over the month to a record level of 2,173,900.
The increase was mostly due to the influence in employment levels occurring in Trade Transportation, and Utilities (+2,600); Professional and Business Services (+1,900); Manufacturing (+1,500); Leisure and Hospitality (+1,100); and Government (+800). Also reporting marginal increases were Information (+200); Education and Health Services (+200); and Financial Activities (+100).
Industries reporting declines were Construction (-800) and Other Services (-300).
From January 2018 to January 2019, South Carolina’s economy has added 34,300 seasonally adjusted nonfarm jobs.
Industries marking growth were Trade, Transportation, and Utilities (+11,700); Professional and Business Services (+8,200); Manufacturing (+7,400); Education and Health Services (+5,200); Leisure and Hospitality (+3,300); Government (+3,000); Information (+600); and Financial Activities (+100).
However, noticeable decreases were seen in Construction (-3,900) and Other Services (-1,400).
Nonagricultural Employment by Industry (Not Seasonally Adjusted2)
Not seasonally adjusted, nonfarm payroll employment decreased by 35,000 from December 2018 to January 2019 for a total of 2,138,100. This decline is a typical for the December-to-January time period due to seasonal layoffs and school closings between terms.
The only industries that saw growth were in Manufacturing (+500) and Mining and Logging (+100).
Industries reporting losses were seen in Trade, Transportation, and Utilities (-10,900); Leisure and Hospitality (-6,900); Professional and Business Services (-5,900); Government (-4,600); Education and Health Services (-3,900); Construction (-1,500); Other Services (-1,300); Information (-300); and Financial Activities (-300).
Since January 2018, not seasonally adjusted nonfarm jobs were up 36,300 overall in South Carolina.
Industries marking strong annual gains were Trade, Transportation, and Utilities (+12,900); Professional and Business Services (+8,800); Manufacturing (7,900); Education and Health Services (+5,100); Government (+2,500); Leisure and Hospitality (+2,400); Financial Activities (+600); Information (+500); and Mining and Logging (+100).
Industries reporting declines were Construction (-2,800) and Other Services (-1,700).
1Seasonally Adjusted: Seasonal adjustment removes the effects of events that follow a more or less regular pattern each year (i.e. tourist-related hiring and school closings in the summer). These adjustments make it easier to observe the cyclical and other nonseasonal movements in data over time.
2Not Seasonally Adjusted: Effects of regular or seasonal patterns have not been removed from these data.


