
Quarterly Census of Employment and Wages: Fourth Quarter, 2024
By Lainey Stalnaker, Data Analytics Writer

The Quarterly Census of Employment and Wages (QCEW) measures changes in employment, establishments, total wages, and average weekly wages at the national, state, and county levels. Data are categorized by sector according to the North American Industry Classification System (NAICS).[1] These data include monthly employment and quarterly wages for workers covered by state unemployment insurance (UI) laws and federal workers covered by the Unemployment Compensation for Federal Employees (UCFE) program, absent certain excluded groups.
South Carolina showed strong wage and employment growth from quarter three to quarter four. Average weekly wages rose in all 46 counties and in all sectors. Total employment in the state increased by half a percentage point, and the majority of counties and industries also reported employment growth.
Employment by Sector
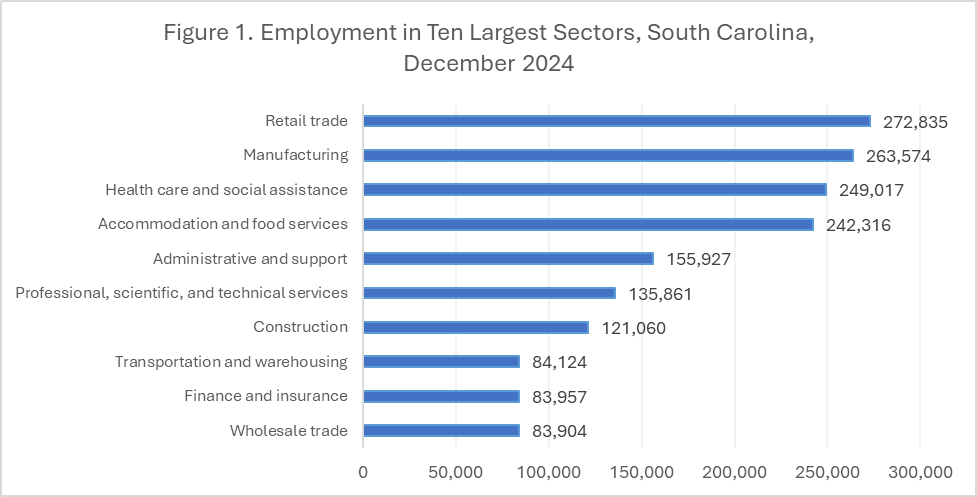
At the end of the fourth quarter, employment was highest in the retail trade sector. With the addition of 6,077 jobs over the quarter, employment reached 273,835 in December, likely a result of elevated hiring during the holiday season. Manufacturing had the second highest employment at 263,574, followed by health care and social assistance at 249,017.
The largest numeric increase in employment was in retail trade. Transportation and warehousing followed, increasing employment by 3,803 jobs (4.7 percent). In third place, the construction sector added 2,017 jobs.
The largest decrease in employment was in accommodation and food services, which recorded a loss of 4,608 jobs, or 1.9 percent. Arts, entertainment, and recreation employment declined by 5.3 percent, or 2,004 jobs. These losses, typical for this time of year, were driven by decreased demand for workers in jobs related to tourism. 1,729 jobs were also lost in administrative and support and waste management and remediation services. Figure 1 shows the ten sectors of the economy with the highest employment during the quarter.
Employment by County
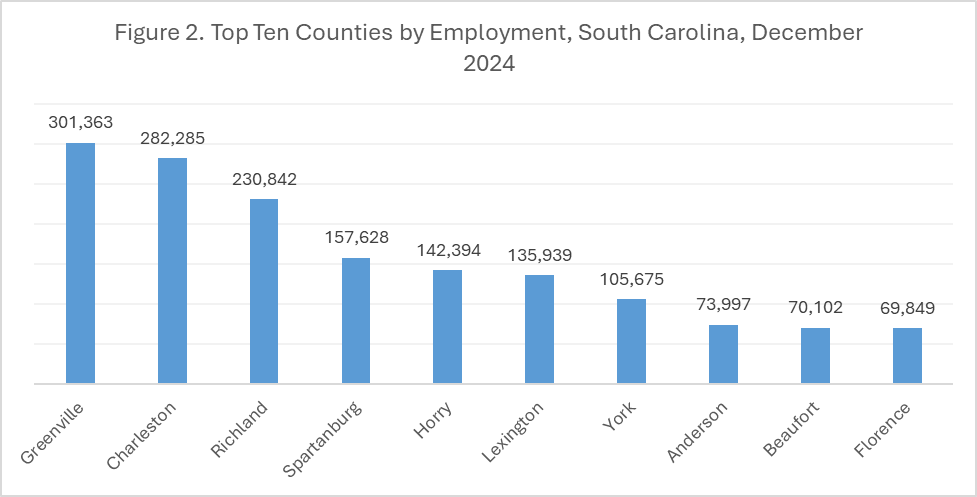
Employment in South Carolina rose from 2,298,920 to 2,310,061 from September to December of 2024, an addition of 11,141 jobs. Greenville County added the most jobs—3,739—and maintained its ranking as the county with the highest employment in the state. Charleston County added 2,897 jobs, Lexington County added 2,738, and Aiken County added 1,095.
Employment increased in the majority of counties, but 16 of 46 recorded declines. The most significant job losses were in Horry County, where employment declined by 3,296, or 2.3 percent, and Beaufort County, which recorded a 2.0 percent decline, or a loss of 1,435 jobs. This was again connected to a reduction in tourism following the end of summer. Figure 2 shows where employment was highest in the state during the fourth quarter.
Wages by Sector
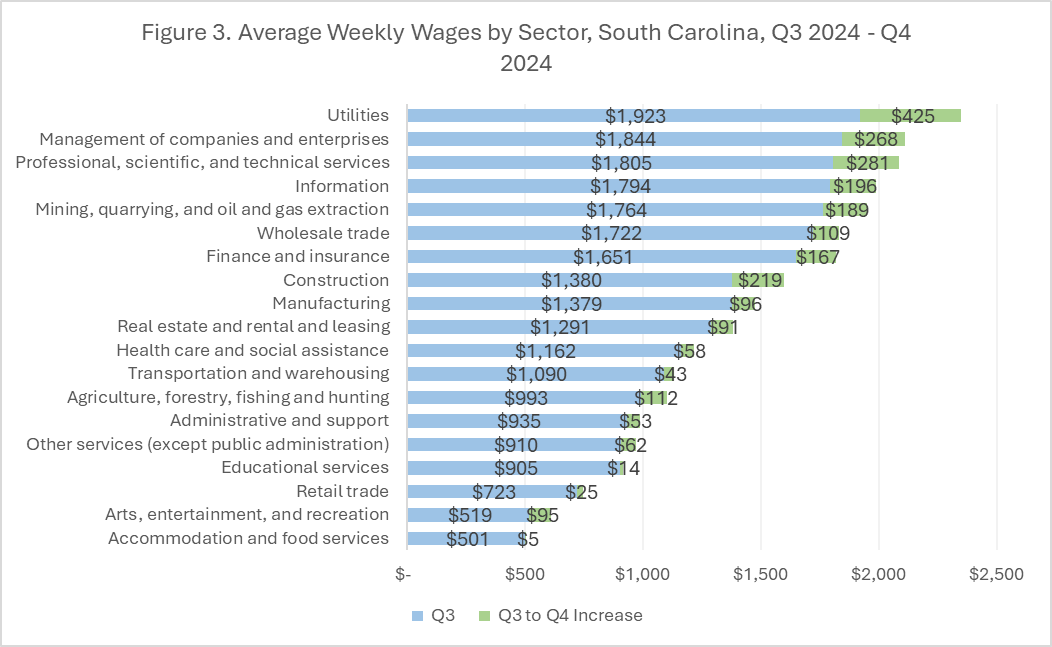
All sectors reported increases in average weekly wages from quarter three to quarter four of 2024. This was an improvement from the previous quarter, during which seven industries recorded a decline in wages. Wages rose fastest in the utilities sector—22.1%, or $425. Arts, entertainment, and recreation came second with wages increasing 18.3 percent, or $95. Construction wages rose 15.9 percent, and wages in the professional, scientific, and technical services sector rose 15.6 percent. Rounding out the top five, management of companies and enterprises recorded a 14.5 percent increase in wages.
Wages across industries typically rise in quarters one and four and decline in quarters two and three, a factor of increased supply of workers during the summer months and a simultaneous surge in part time work opportunities. Quarter four’s massive increase in wages in the utilities sector, however, goes beyond what is usual for this time of year, and points to atypical circumstances.
Figure 3 shows wage growth for all sectors in South Carolina during quarter four of 2024. At the top of the list was utilities; management of companies and enterprises; and professional, scientific, and technical services. The lowest wages were recorded in accommodation and food services; arts, entertainment, and recreation; and retail trade.
Wages by County
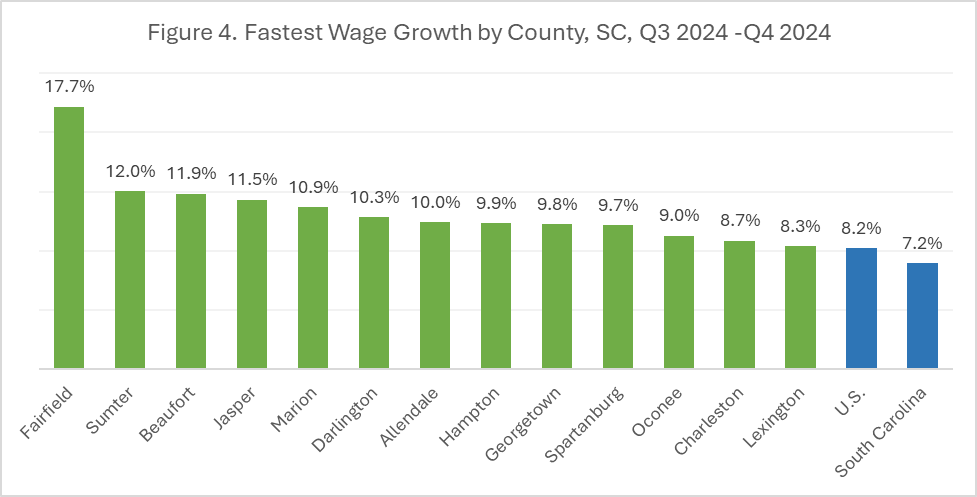
Average weekly wages in South Carolina were $1,223 in quarter four, up $82 from quarter three. The highest wages were recorded in Charleston County, which averaged $1,389 per week; Berkeley County, averaging $1,346 per week; and Fairfield County at $1,294 per week. Also in the top five, Lancaster and Greenville Counties averaged wages of $1,279 and $1,265, respectively.
Wages in all 46 counties increased from quarter three to quarter four, and wages in 13 counties rose faster than the U.S. average of 8.2 percent, shown in Figure 4. At 17.7 percent, wages in Fairfield County rose the fastest, increasing $195 and leading Fairfield to rise seven spots in the wage rankings. The increase in Fairfield appears to be driven primarily by wage growth in the finance and insurance sector and the professional, scientific, and technical services sector.
Conclusion
The latest QCEW data point to strong economic growth in South Carolina—across counties and industries. Wages rose in every county and in all sectors at the state level in quarter four, with particularly large increases in Fairfield County and in the Utilities sector. South Carolina also continued the trend of steady employment growth, underscoring the vitality of the labor market.