Which Types of Occupations Have the Largest Supply Gaps?

By Lainey Stalnaker, Data Analytics Writer
On June 17th, LMI published its second annual Supply Gap Analysis (SGA), which evaluates how well South Carolina’s educational institutions (both secondary and post-secondary) are able to meet employer demand for workers. The supply gap is calculated by subtracting the number of workers qualified for a given occupation from the number of new positions in demand in the same year within that occupation. This article gives a quick peek at the major findings, but the full report can be accessed on the LMI website.
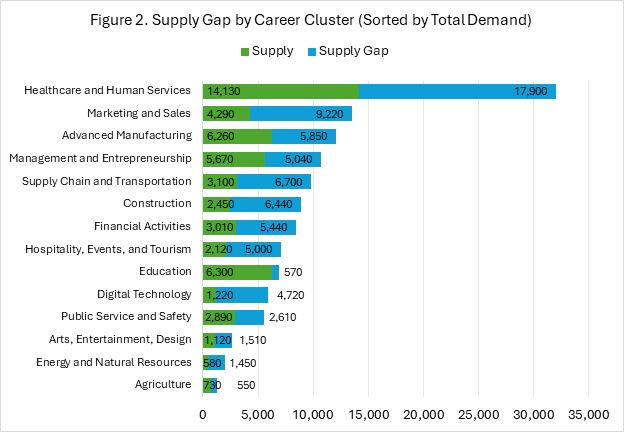
The total supply gap across all occupations in South Carolina is about 73,000 jobs per year. Of this gap, 46 percent is for occupations requiring a high school diploma, accounting for about 34,000 workers. An additional 27 percent of the supply gap is for jobs typically requiring a bachelor’s degree. Another 20 percent is for jobs requiring some college, such as an associate degree or a post-secondary nondegree award. And 6 percent is for jobs typically requiring a graduate degree. Figure 1 breaks down the supply gap by typical entry-level education required. Both overall demand and total unmet demand (i.e., the supply gap) are largely composed of jobs requiring a high school diploma or its equivalent.
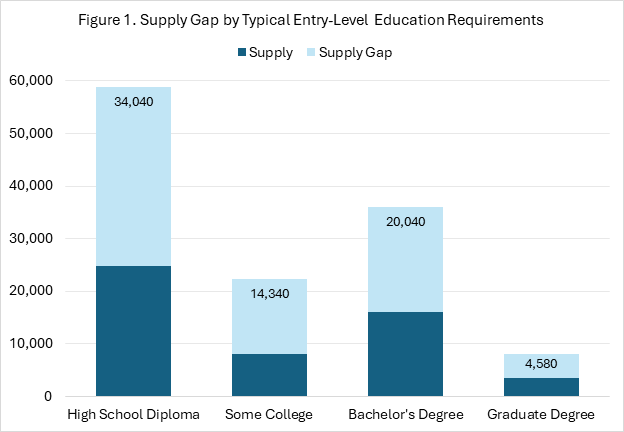
Figure 2 breaks down the supply gap by career cluster, which is a framework that categorizes occupations according to their primary purpose and typical education pathways. One career cluster stands out among the rest: Healthcare and Human Services, which had approximately 32,030 openings for 14,130 graduates, resulting in a supply gap of 17,900. In second place, Marketing and Sales had a supply gap of 9,220. Supply Chain and Transportation had the third largest supply gap at 6,700.
The career clusters with the smallest supply gaps—which is to say, those where supply and demand are most balanced—were Agriculture, which had a supply gap of 550, and Education, which had a supply gap of 570. These two career clusters also had the lowest demand-supply ratios, which represent the number of new jobs divided by new graduates. Most notably, the demand-supply ratio for the Education career cluster was just 1.09, meaning new jobs exceeded new graduates by just 9 percent.