Quarterly Census of Employment and Wages: Fourth Quarter, 2025
By Lainey Stalnaker, Data Analytics Writer

The Quarterly Census of Employment and Wages (QCEW) measures changes in employment, establishments, total wages, and average weekly wages at the national, state, and county levels [1]. Data are categorized by sector according to the North American Industry Classification System (NAICS). These data include the monthly employment and quarterly wages for workers covered by state unemployment insurance (UI) laws and federal workers covered by the Unemployment Compensation for Federal Employees (UCFE) program, absent certain excluded groups.
The QCEW covers more than 95 percent of U.S. jobs, making it a reliable source of employment data; however, QCEW data are not released until about five months after the period they cover. The Current Employment Statistics (CES) program provides more immediate employment estimates, but these estimates may be subject to sampling errors. CES and QCEW estimates of employment may differ slightly, as they are produced through different methods. More information about the production of employment and unemployment data can be found here.
Employment in South Carolina increased by 34,779, or 1.5 percent, between December 2024 and December 2025, outpacing the national growth rate of 0.2 percent. Wages increased 4.3 percent.
Wages by County
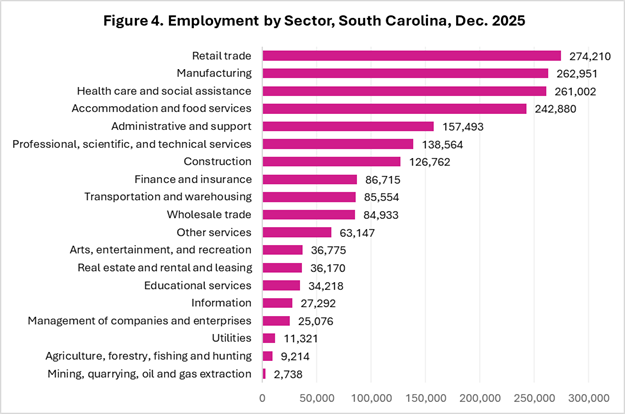
During the fourth quarter of 2025, average weekly wages in South Carolina were $1,276, which was $53 more than in the fourth quarter of 2024. The majority of counties recorded a wage increase over the year. Average weekly wages were highest in Charleston County ($1,458), Berkeley County ($1,406), and Greenville County ($1,319). Average weekly wages in South Carolina’s most populous counties are shown in Figure 1.
Employment by County
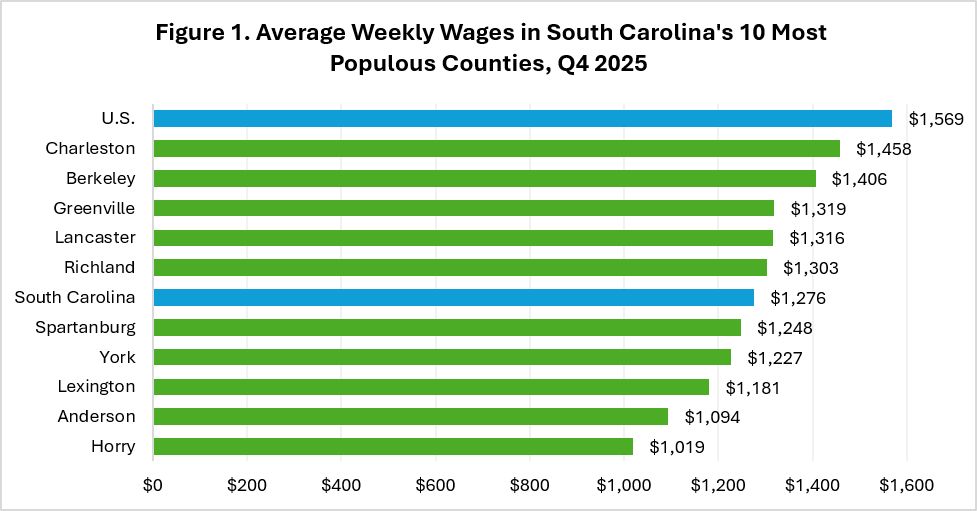
Year-over-year change in employment varied by county. A total of 26 counties recorded employment growth. Fairfield County was at the top of the list with a 6.7 percent increase in total employment between December 2024 and December 2025. Berkeley County came second at 5.4 percent. Employment fell in 20 counties, most severely in Georgetown County, which recorded a 6.0 percent reduction in jobs, as well as Hampton County, where total jobs fell 5.5 percent. Change in employment across all counties is shown on the map below.
Figure 2. Percent Change in Employment by County, Dec. 2024 – Dec. 2025
Wages by Sector
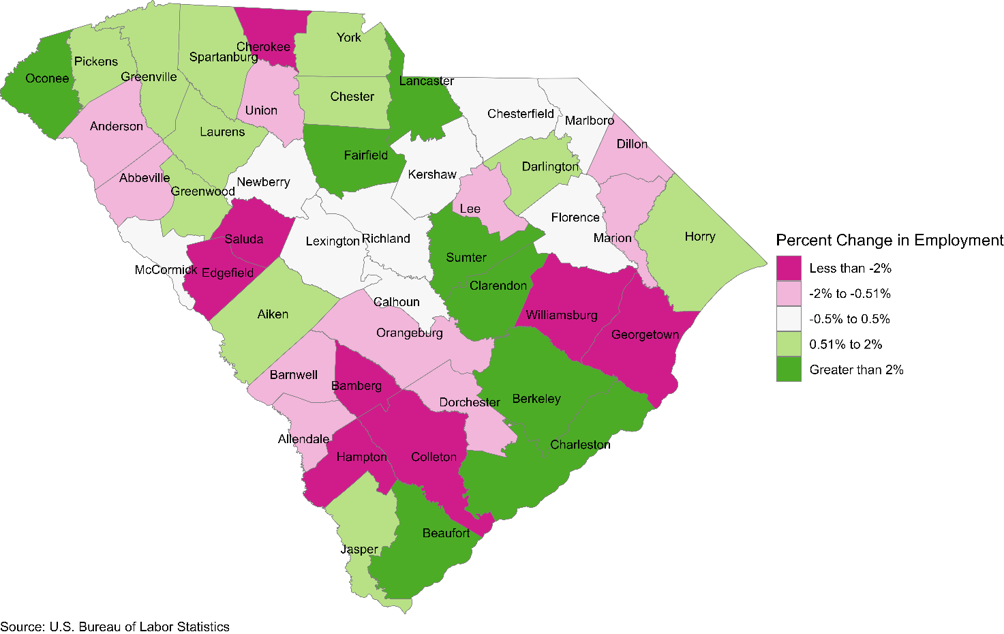
Average weekly wages were highest in the Utilities sector at $2,278. Three other sectors recorded wages higher than $2,000: professional, scientific, and technical services ($2,213); management of companies and enterprises ($2,153); and information ($2,142). From Q4 2024 to Q4 2025, wages increased in all but four sectors. The largest gains were in the information sector (+7.7%); professional, scientific, and technical services sector (+6.1%); and construction sector (+6.1%). Average weekly wages at the sector level are shown in Figure 3.
Employment by Sector
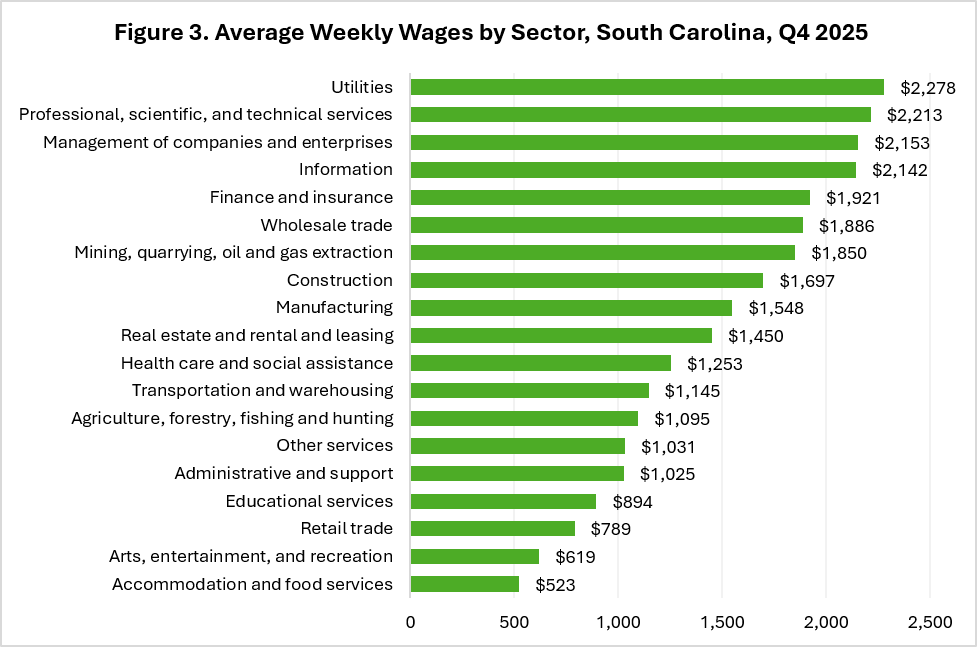
In December 2025, employment was highest in the retail trade sector (274,210), manufacturing sector (262,951), and health care and social assistance sector (261,002). Year-over-year, health care and social assistance added the most jobs at 11,790, a 4.7 percent increase, followed by the construction sector, which recorded an addition of 5,691 jobs, also at a rate of 4.7 percent. The fastest growth was recorded in the mining, quarrying, oil and gas extraction sector, which grew 17.3 percent and added 404 jobs. Figure 4 shows employment for all sectors.