Quarterly Census of Employment and Wages Data Analysis: Quarter One, 2023
By Taylor Hendrix, Workforce Insights Analyst

The Quarterly Census of Employment and Wages (QCEW) is a data set composed of employment, total wage, and average weekly wage data by industry. These figures are acquired quarterly from employment and wage reports submitted by South Carolina employers. Industry data is categorized under the North American Industry Classification System (NAICS) by several different sectors, generally fitting into either a goods producing industry or a service providing industry.
Statewide Employment and Wage by Industry Data
Statewide QCEW data is broken down by number of establishments, employment size in the first, second, and third months of the quarter, an average of employment size for all three months, followed by total wages and average weekly wages for each industry. For the first quarter of 2023, the industry with the most establishments was the Professional and Technical Services industry with 28,926. Health Care and Social Assistance was the industry with the most employment in all three months of the quarter, ranging from 294K to 297K for each month. Manufacturing brought in the most total wages for that quarter, at $4.8 billion. The industry with the highest average weekly wage was the Management of Companies and Enterprises industry, with $2,208 in earnings.
County Employment by Industry Data
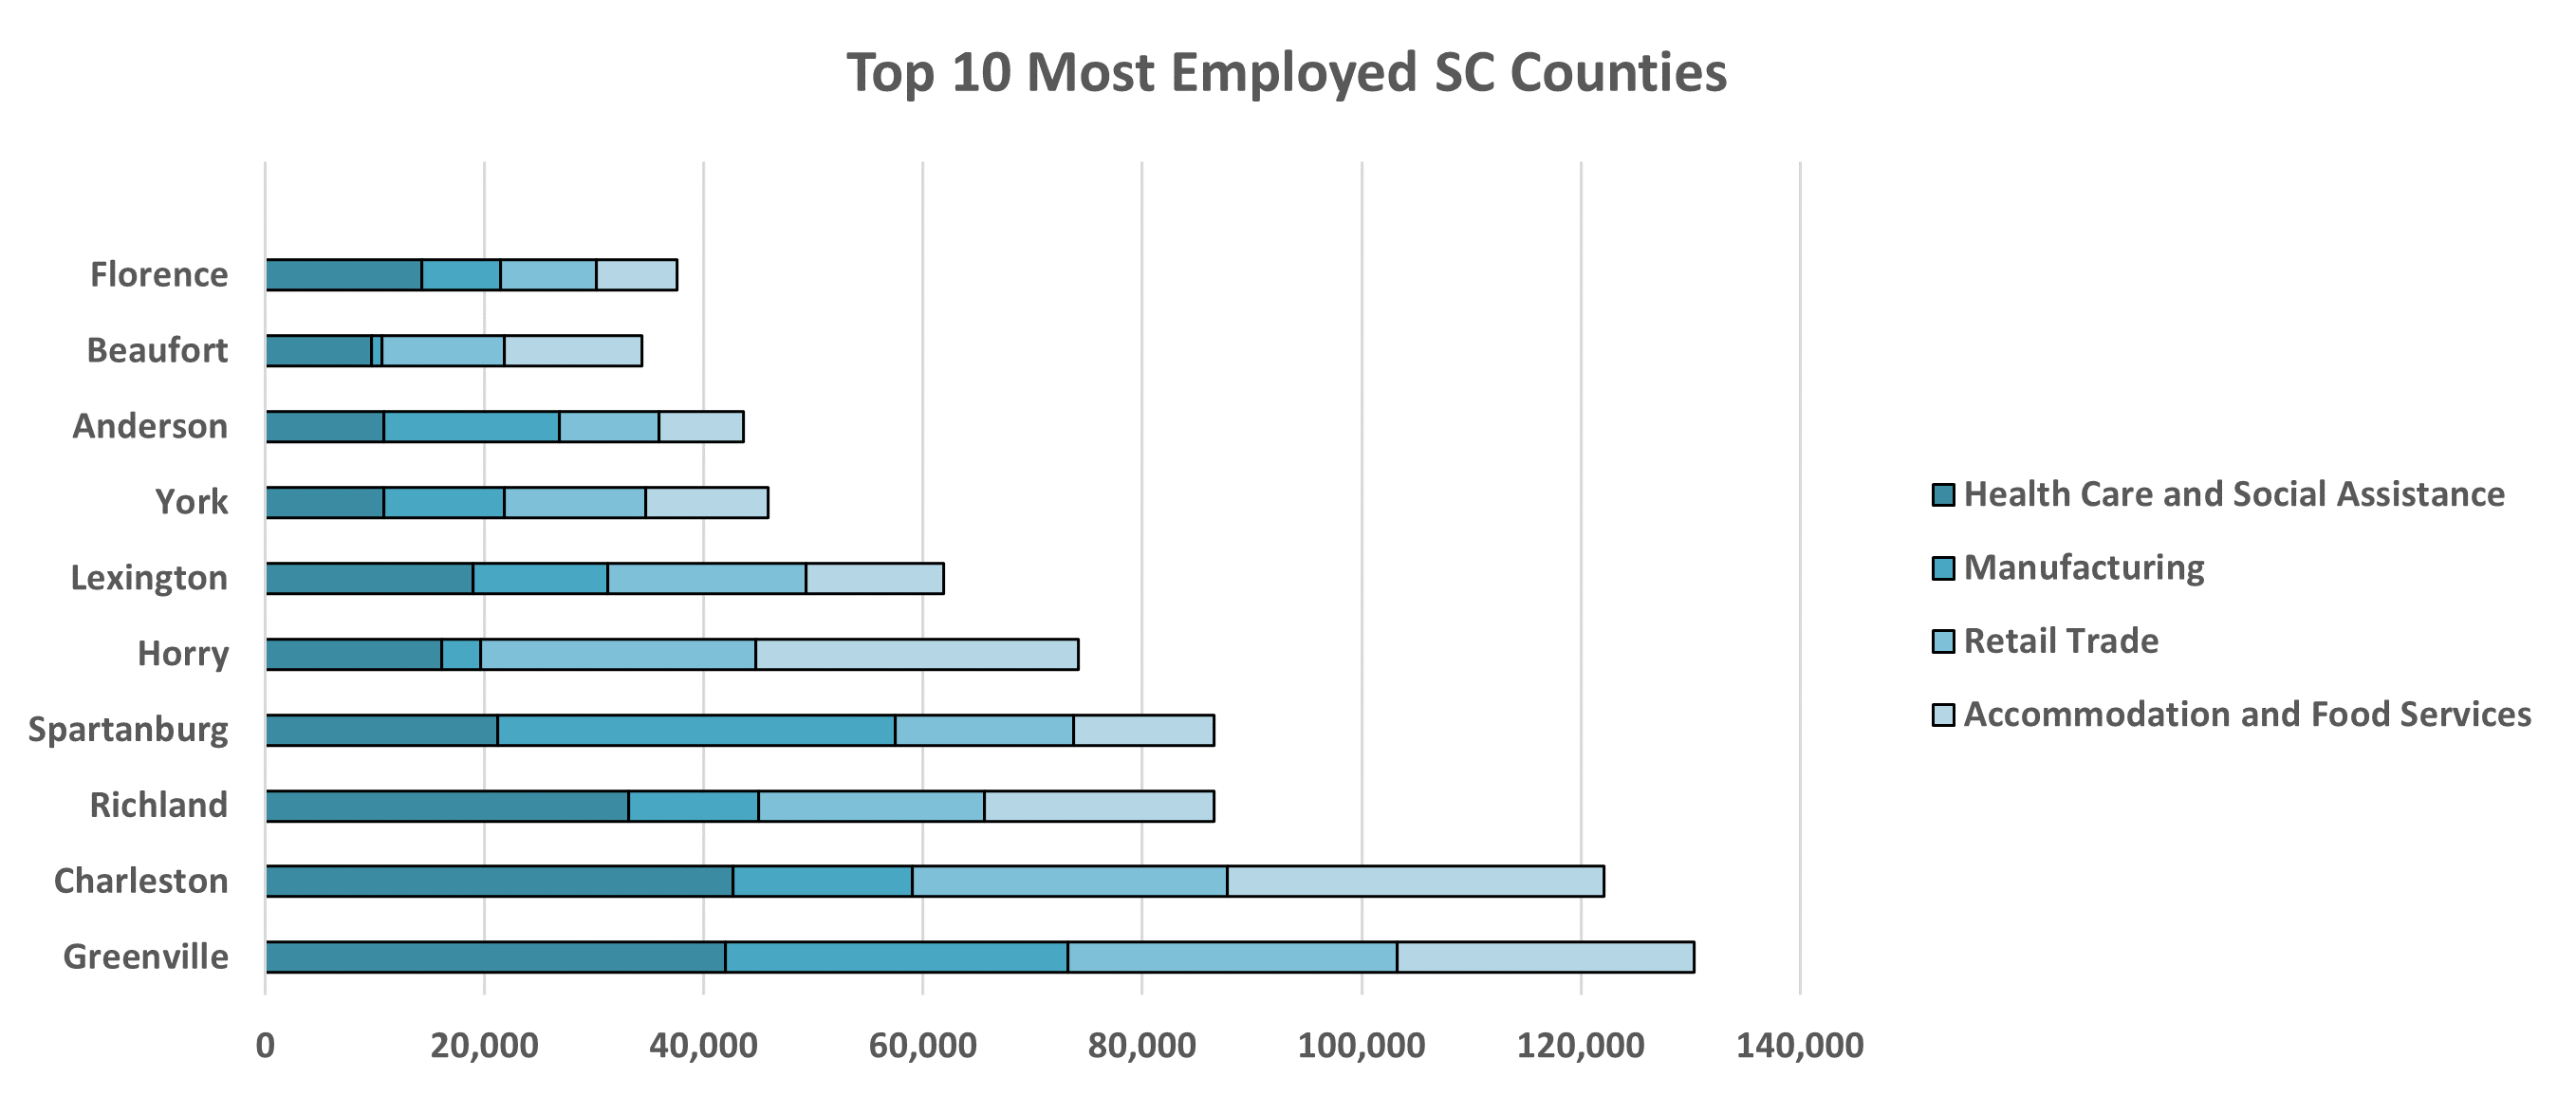
The three counties with the most employment for the first quarter of 2023 were Greenville (288,575), Charleston (268,610), and Richland (222,699). In those three counties, the Health Care and Social Assistance industry employed the most people. Below is a data table showing a closer look at these numbers among the top 10 most employed counties and some of their more populous industries.